The data that drives the SaaS methodology model can be categorized into three types: volume metrics, conversion metrics, and absolute time metrics. Each of these work in systems to drive the different stages of revenue generation: customer acquisition, recurring revenue, and lifetime value.
Measuring Data
Many organizations are excited about the amount of data flowing into their customer relationship management (CRM) or marketing automation systems (MAS). Despite the influx of data, however, many organizations are also uncertain how to interpret and best utilize it. There is a tendency to compare apples to oranges, which results in either no action or bad action which has an adverse impact on the business.
Most decisions in sales today are guided by data, so a company must establish the correct data model for itself. Companies must ensure they are measuring from the same point and comparing against the same criteria in the same way. Start by standardizing exactly what your company is going to measure.
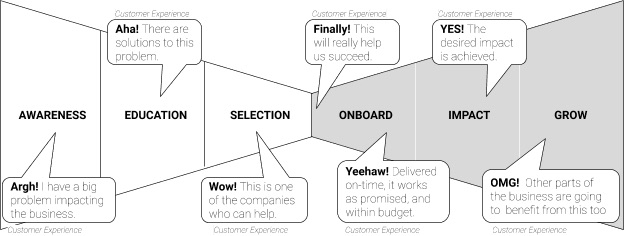
Figure 1. The Recurring Revenue Model
The SaaS Methodology Data Model
The Recurring Revenue Model is a customer-centric model based on seven unique customer experiences during the stages of the sales cycle, as shown in Figure 1 above, and it is the backbone of SaaS Methodology. There are three types of metrics that contribute to the SaaS Methodology data model:
- Volume Metrics. These will measure how much volume, such as leads, deals, etc., your company has.
- Conversion Metrics. These will measure how many inputs are needed to generate the desired output.
- Absolute Time Metrics. These measure how long it takes to convert input into output.
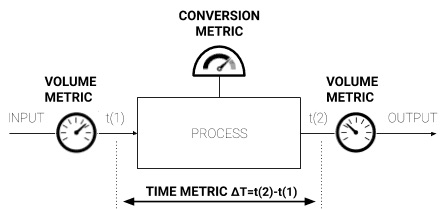
Figure 2. The SaaS Methodology is a scientific model that uses three types of metrics
Volume Metrics
Volume metrics are quantities of items (such as the number of leads, commits, or revenue) present or generated at any given step in the sales process. See Figure 3 and Table A for the different volume metrics and their respective definitions.
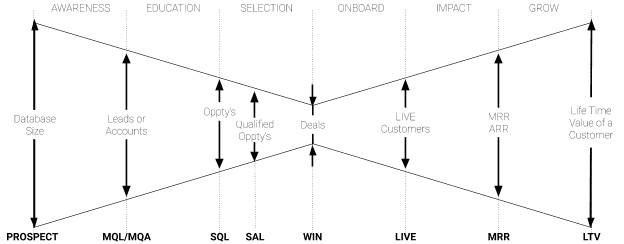
Figure 3. Volume metrics throughout the sales process
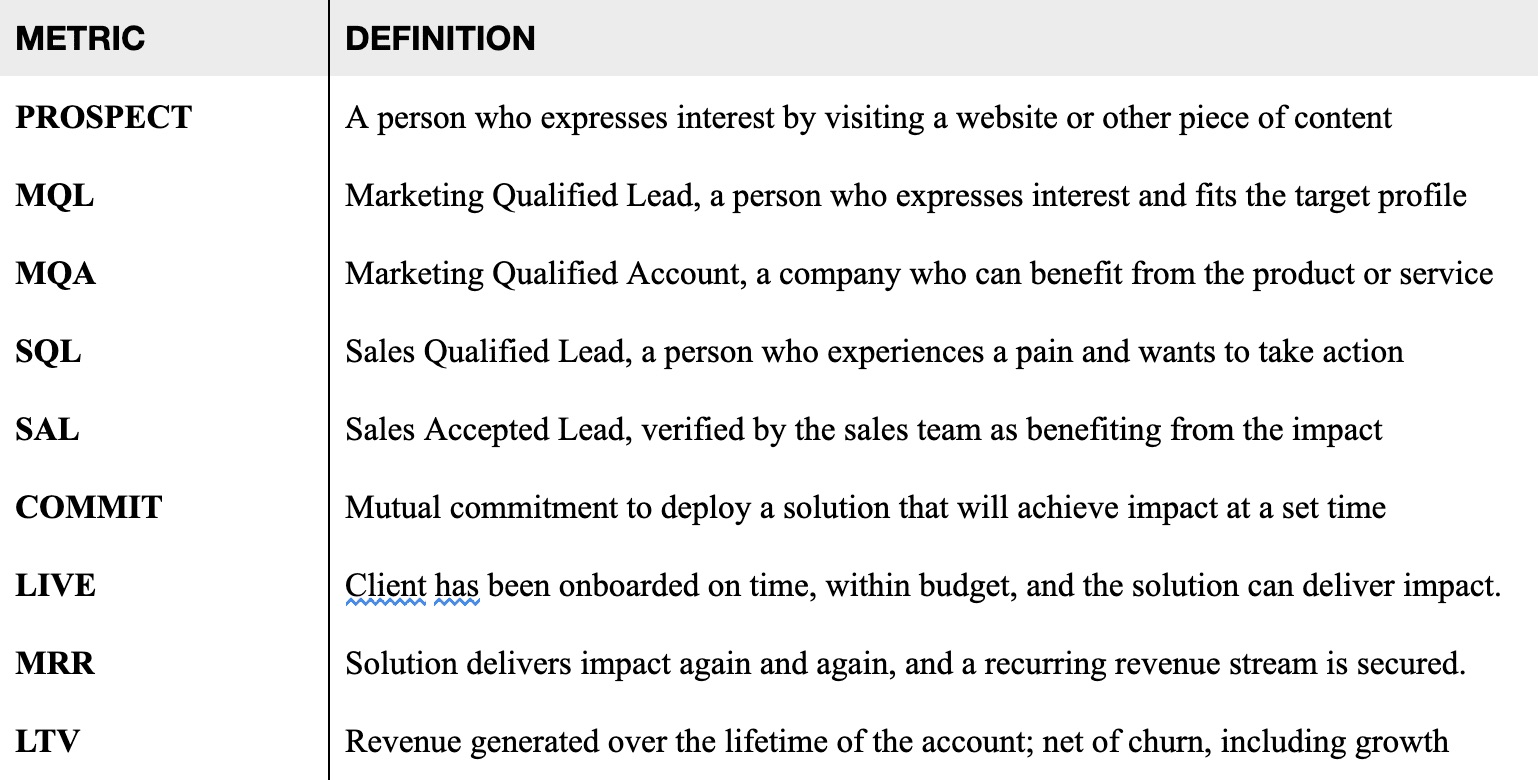
Table A. Volume metrics defined
The Order of SQLs vs. SALs
The typical diagram of a Sales Qualified Lead (SQL) in a sales funnel will depict a process whereby marketing delivers Sales Accepted Leads (SALs) and then sales qualifies them as SQLs. This is the wrong order. In sales, you should qualify first and then accept. When sales accepts a lead, it is held accountable for the win rate and the sales cycle. See Figure 4 for a visual representation of the correct order. To clarify the process, the figure uses an emergency room visit as an example because hospitals are analogous in that they expand the quantity and quality of resources based on the diagnosis. Table B shows questions to ask at each step of the sales process.

Figure 4. Correct depiction of Sales Qualified Lead before Sales Accepted Lead
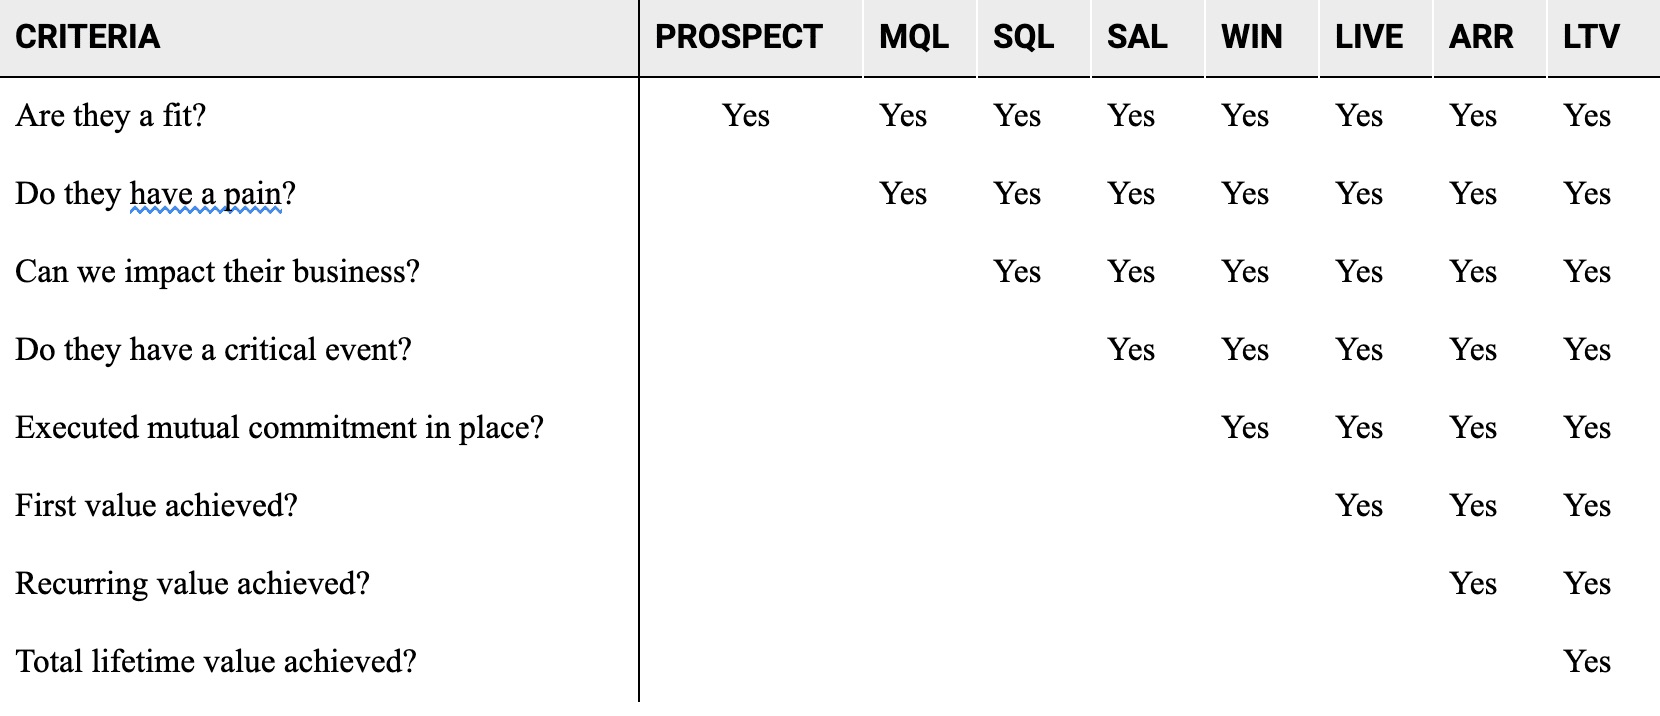
Table B. Questions to ask at each stage of the process
Conversion Metrics
Conversion metrics measure the volume of the output of a process divided by the volume at input. They indicate the rate at which you are converting at each step. See Figure 5 and Table C for conversion metrics throughout the sales process and their respective definitions.
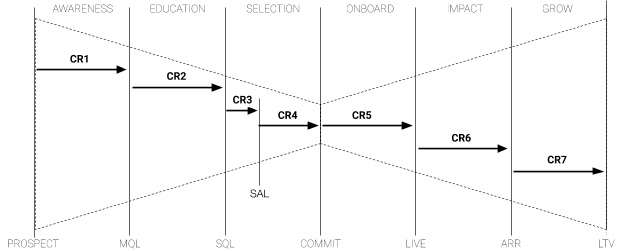
Figure 7.5 Conversion metrics throughout the sales process
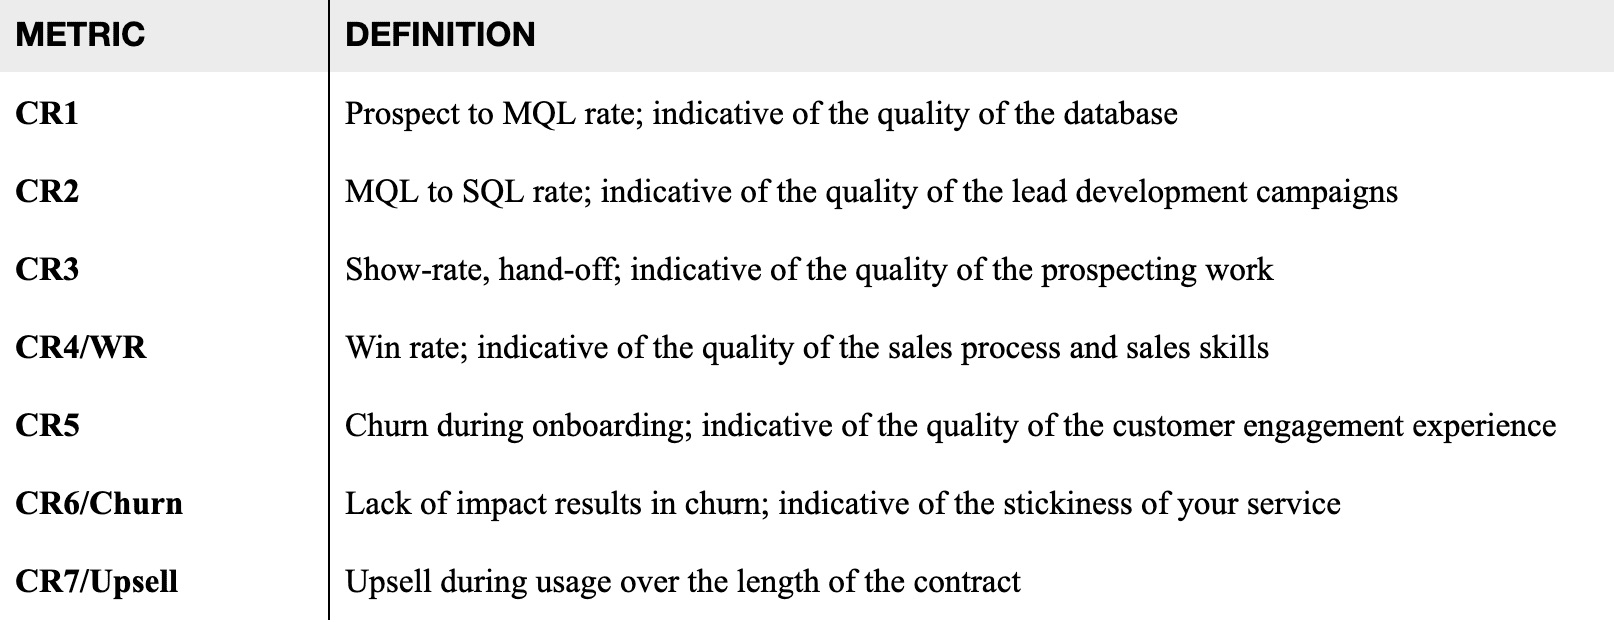
Table C. Conversion Metrics defined
The Importance of CR3 and CR4
When looking at the conversion rates, CR3 and CR4 stand out. CR3 refers to how many meetings were set for the sales team versus how many of those turned into an opportunity (also known as the sales pipeline). There are two reasons why this is not 100%. First, there are no-shows, or prospects who commit to a meeting to get you off the phone but do not show up to the meeting. Second, there are unqualified leads, or prospects who upon further review cannot be helped by the company’s product at this time.
In the case of a two-stage organization, the prospector (SDR) had a short conversation with the client who agreed to a discovery call with the sales manager or account executive (AE). CR3 and CR4 (win rate) are particularly important as they provide insights into team efficacy and where it can be improved. See Table D for suggestions based on these two conversion metrics.
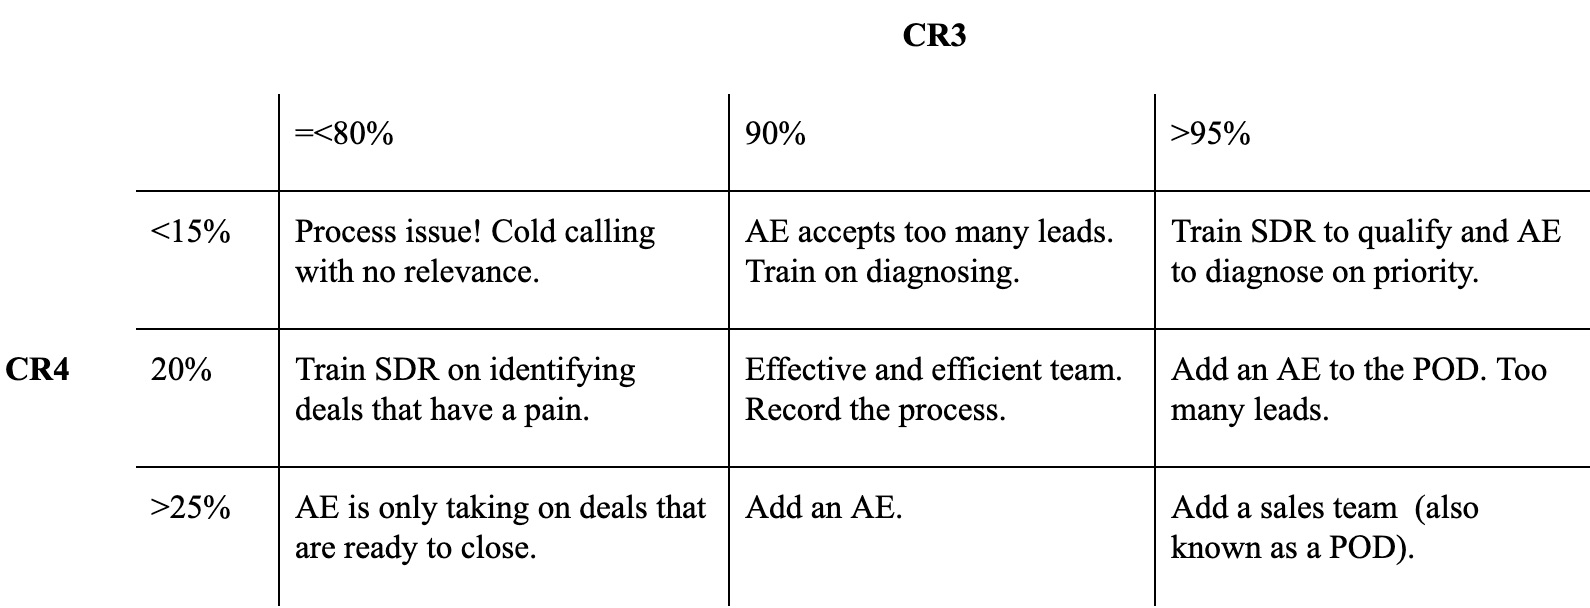
Table D. How CR3 and CR4 conversion metrics can diagnose sales issues
Absolute Time Metrics
Absolute time metrics are defined as the delta in the time it takes to convert one volume metric into another volume metric. See Figure 6 and Table E for absolute time metrics throughout the sales process and their respective definitions. The length of time it takes to convert one metric into another is determined not by the actual activity in the process but by the waiting time in between the processes. For example, it may take five minutes to write an email invitation to an event, but it can take days to get a response.
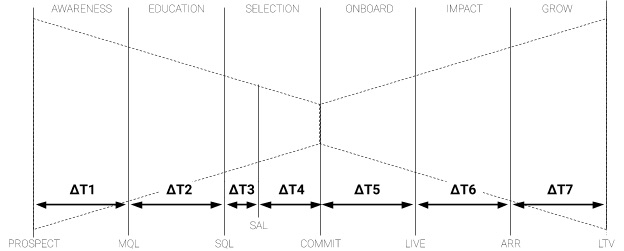
Figure 6. Absolute time metrics through the sales process
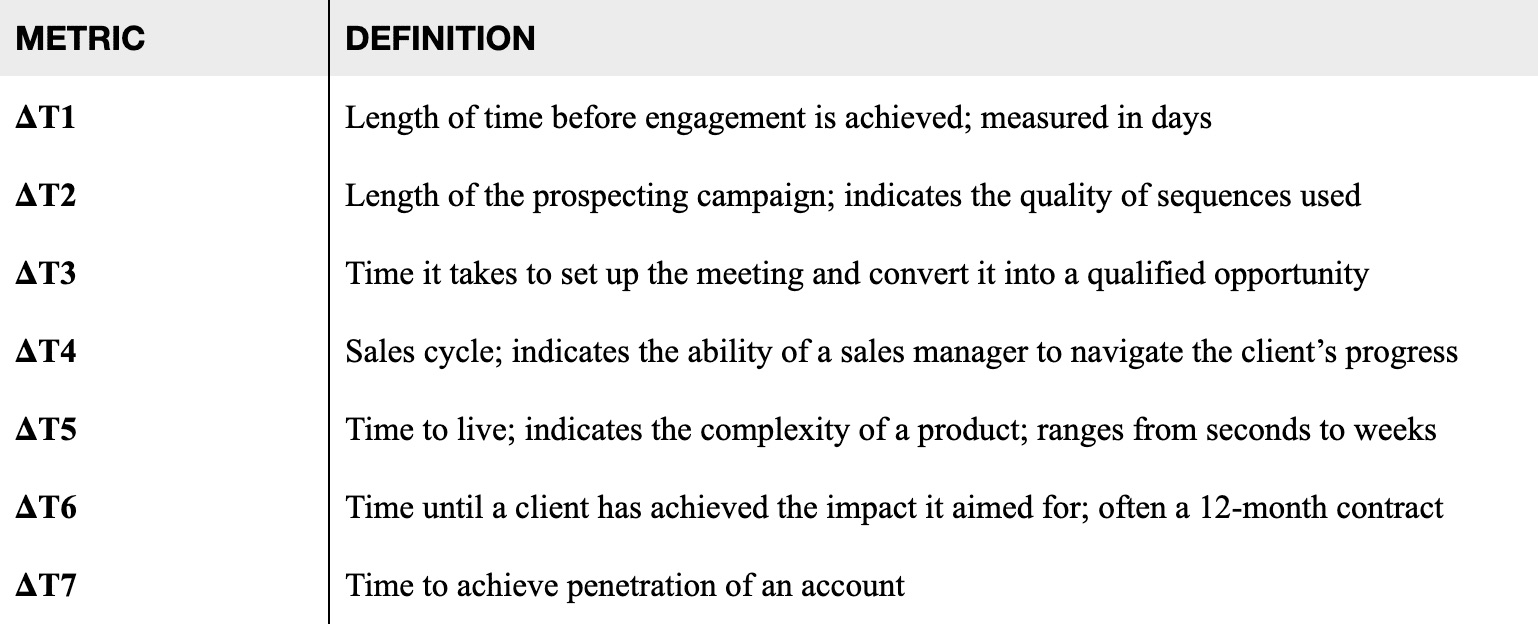
Table E. Absolute time metrics defined
Fast Response Times Can Backfire
One of the most common marketing mishaps involves an inbound lead or MQL. When a client reaches out, they generally have a pain that motivated them to do so. In that first conversation, the seller should make sure they are fit before scheduling a discovery/demo call. An inbound call is time sensitive, and the faster the response, the higher the chance of a successful outcome.
Viewing it from the buyer’s perspective, they have finally found the product they want to purchase but they cannot get it until they “talk to someone” on the seller’s side. They leave their phone number, enter their email address, and wait for some to contact them. B2C metrics say that the majority of people spend five minutes (at most) waiting for a response or checking their inbox for a reply [Ref. 1].
Drift, a company that specializes in customer web chat, performed research which showed that as of mid-2018, only 7% of 433 companies contacted responded within five minutes. Even worse, 55% of the companies did not respond within five business days [Ref. 2].
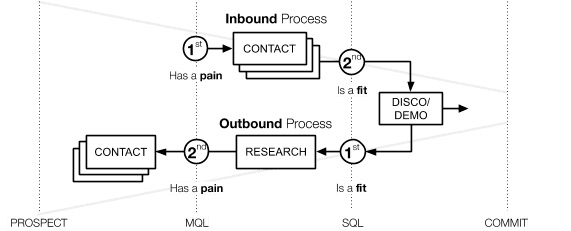
Figure 7. Inbound vs. outbound processes: fit and pain are reversed, causing the wrong, time-sensitive response
In general, an inbound process consists of a series of actions such as sending an email, making a phone call, and leaving a voicemail. As an example, many people experience this process when reaching out to a dentist.
However, this time-sensitive process is often used in the wrong circumstances. For instance, if a client provides an email address so that they can download a research paper from your website, in many cases, this lead will be miscategorized as an MQL. As a response, the sales development rep calls the prospect immediately, leaves a voicemail, and sends a follow-up email as if the client has expressed a pain – but they never did. Now, the client feels intimidated by the assertive follow-up.
Companies must learn that not every MQL is created equal. In this case, the MQL should have gone into the outbound process, during which research would have been performed to determine if this client had a pain the company could solve. See Table F for more examples of true inbound leads compared to quasi-inbound leads.

Table F. Examples of true- and quasi-inbound leads and appropriate responses
Sales as a Science
All sales leaders have been in situations where their sales team is falling short of its targets. In that circumstance, most tend to respond by thinking about how many more deals they must add to meet that target. The more sophisticated among them may also consider how many more incremental meetings, sales opportunities, or marketing qualified leads they need in order to achieve that goal. In other words, most sales leaders are thinking in additive terms, which is a result of each department working by itself with an individual additive goal. This is more commonly referred to as “operating in silos.”
Generating revenue is not a one-time event that happens in one meeting, performed by a single person. Rather, revenue is the product of connected events across a series of meetings, working together in a system that is run by several people. This system is based on connected revenue propulsion systems that operate during three different stages:
- Stage 1: Acquire Customers
- Stage 2: Achieve Recurring Revenue
- Stage 3: Extend the Customer Lifetime
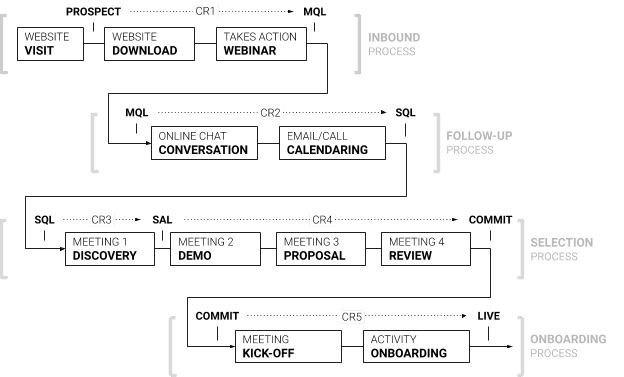
Figure 8. Example of the Acquisition Process: a series of activities form the processes that work together as a system
Stage 1: Customer Acquisition & System Impact
During customer acquisition, there are typically four different processes at play, as depicted below in Figure 9. Each process is based on a series of interactions, and each of these interactions has a conversion. The end result of the entire Customer Acquisition process is the product of these conversion rates (CR).
For a practical example that illustrates these processes, consider a high-velocity prospect who visits your company website. Following some browsing, she likes a white paper and enters her email address to gain access. As she is reading the paper, she receives an invitation to attend a webinar with an expert in the field. She signs up for the webinar, and with that action, she becomes an MQL. Unfortunately, she is unable to attend the webinar.
The day of the webinar, she goes back to the website where a chatbot welcomes her back. The chatbot knows she was unable to attend and asks if she would like to watch the recording. She likes this idea and watches the condensed version of the webinar. The chatbot then asks if she wants to set up a discovery call. She says yes and is linked to a live chat with Mike, the SDR. Mike learns her name is Nikki and suggests a few time slots to meet. Nikki picks a time and receives confirmation via email. She has now become a SQL.
The next day, Nikki dials into the discovery call where Mike introduces her to Yuri, the AE. Yuri diagnoses Nikki and concludes the company can help her. She has now become a SAL. Yuri suggests a real-time demonstration. Nikki loves the demo and asks for the price. Yuri offers a range of prices based on her exact needs, and together they hone in on their options. Nikki asks for a proposal so she can take it to her organization. A few days later, both parties meet to review the proposal. Nikki has invited the VP of Finance who seeks agreement on a few terms.
The next day, the agreement is executed, and a kick-off is scheduled. During the kick-off, Nikki adds the Director of Sales Ops who integrates the service into their cloud suite. On Monday, she and her team are live.
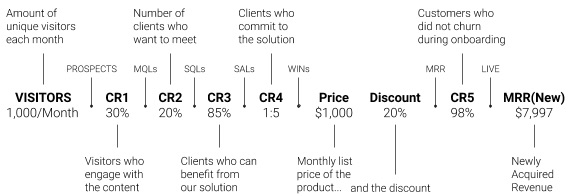
Figure 9. High-velocity sales based on web visitors
How to Calculate Acquired Monthly Recurring Revenue
Figure 9 displays the steps that prospects – who begin as website visitors – progress through during the sales process. These steps are accompanied by sample conversion rates, prices, and discounts that a company might achieve or create during the Customer Acquisition stage. The formula for calculating Monthly Recurring Revenue, known as MRR(New), based on website traffic is as follows:
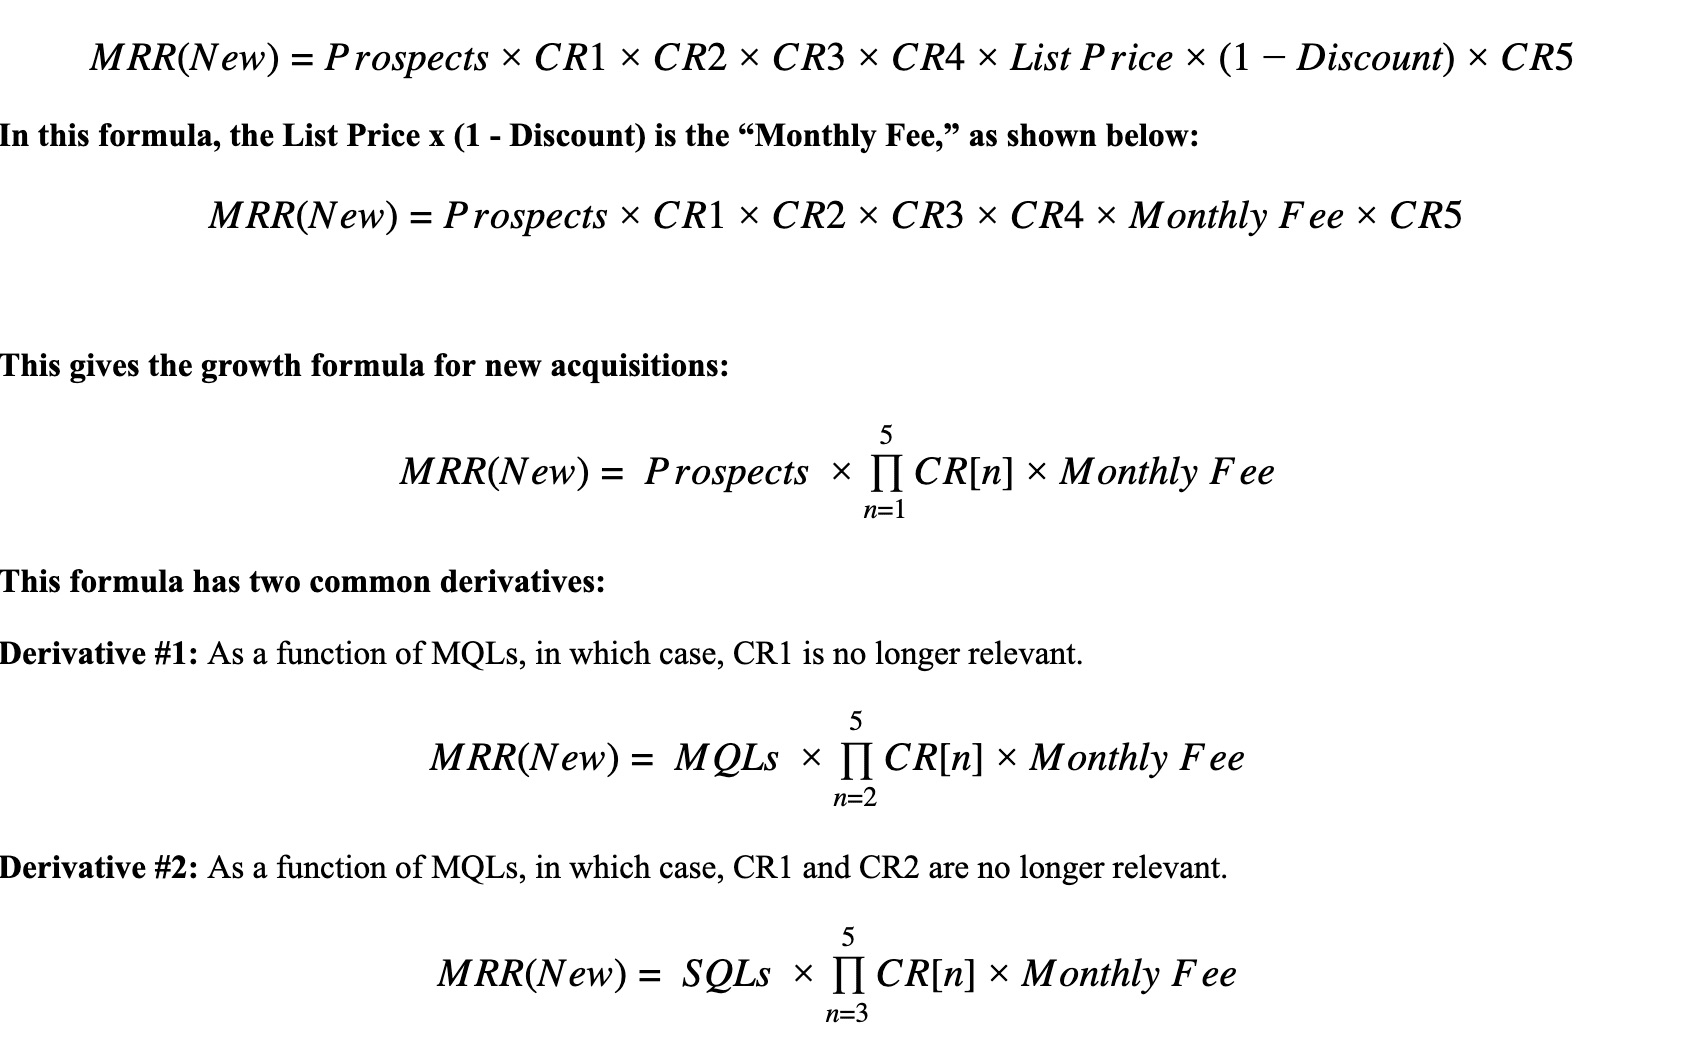
By improving the performance of each conversion rate independently, the impact on newly acquired Monthly Recurring Revenue can be measured. Table G below demonstrates the impact of improving a single conversion rate, CR2, on MRR(New). This example is based on 1,000 prospects. CR2 is the conversion rate between MQL and SQL, which is the result of a call or email by a sales development rep in a high velocity sale.

Table G. Change in MRR(New) as CR2 increases
With this single percentage point improvement, the impact on MRR(New) is five percent. As an example, such an increase in performance could be the result of the use of an online chatbot. However, not every improvement creates the same results. Some improvements impact results in a much larger way. For example, with win rate and discount, their impacts are greater as they occur within a much smaller data set.
Win Rate: In sales, there has been a big change in win rate since the once-standard 1 in 3 of Enterprise Selling. Today, the average performance is about 1 in 5, with the best in class operating at a win rate of 1 in 4 [Ref. 3]. See Table H as an example of the effect that an increased win rate (C4) has on new Monthly Recurring Revenue.

Table H. Change in new MRR(New) as CR4 (win rate) increases
Discount: Recurring revenue models were never designed for discounts. In a way, compared to the previously used Perpetual Business Model, they are already the discount model. To make matters worse, many companies have fallen into the habit of discounting prices at a set rate of 10% or 20%. Large increases in discount levels have a pronounced negative impact on the new Monthly Recurring Revenue generated by the company. Table I provides an example.

Table I. Change in MRR(New) as discount decreases
As you can see from these results, in terms of individual conversion rates, win rate and discount level have the most pronounced impact on newly acquired Monthly Recurring Revenue. This impact is displayed in Figure 7.8 below.
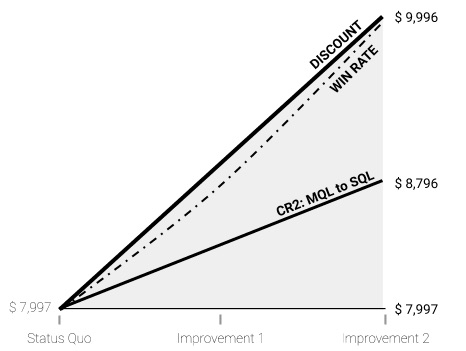
Figure 10. Discount level and win rate impact on MRR(New)
System Impact: Small Changes Equal Big Results
In this cohesive system which is impacted by a series of conversion metrics, the major realization and actionable lesson for companies is this: When you improve each conversion metric by just a small amount, the recurring revenue stream nearly doubles, even when using the same number of prospects (1,000). This is known as “system impact,” and the results can be seen in Table J and Figure 11.

Table J. Results of incremental changes in conversion rates (CR) on MRR(New)
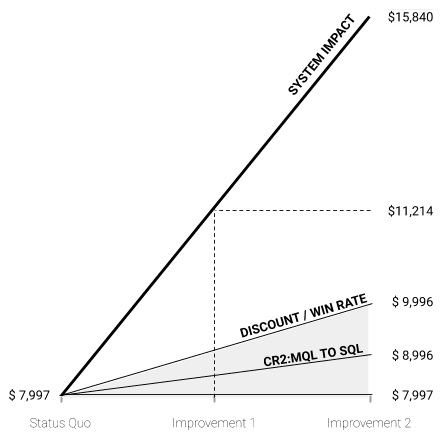
Figure 11. System impact shows small improvements result in 2x MRR(New)
At the system level, revenue organizations work multiplicatively rather than additively. The effort and results of each link in the sales chain are magnified or diluted by the next. Therefore, massive changes in outcomes are possible by making marginal improvements across the chain rather than by simply improving any one link.
Despite this fact, most sales leaders are of the mentality that they could not improve sales by 2x without increasing the top of the funnel, but they would likely sign up to improve their discovery call conversion rate by 10%.
Stage 2: Recurring Revenue & Compound Impact
After learning how to double the recurring revenue stream with incremental changes, companies should next focus on creating a compound impact from their revenue using Churn and Upsell metrics. The following examples begin with a monthly model and proceed to an annual model.
Churn: In the Recurring Revenue stage, not every customer comes back. This is normal, and it is referred to as “churn” (CR6). Unlike the Customer Acquisition stage of business, this stage experiences a different growth formula, which is used in nearly all areas of finance, known as Future Value (FV).
FV incorporates a compound element based on a period(s) of the interval measured over time, as follows
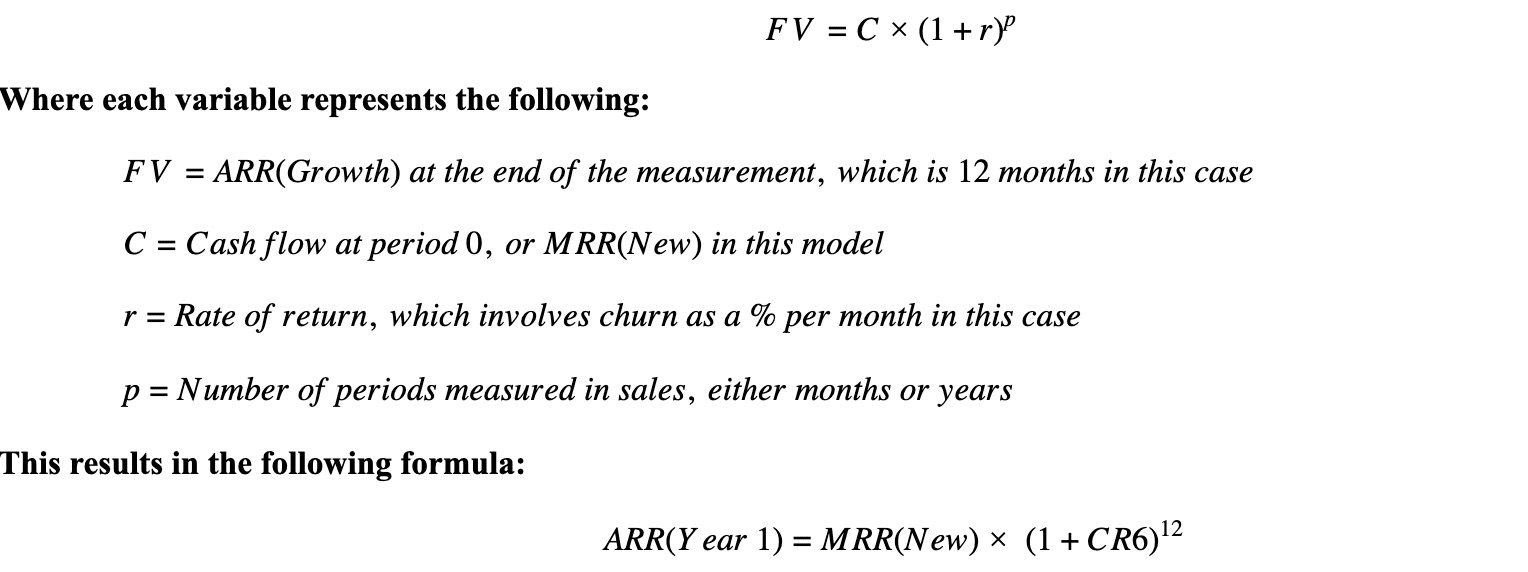
Table K shows the impacts of periodic churn on revenue based on a 12-month contract:

Table K. Impacts on revenue based on changes in churn rates (CR6)
Upsell: Companies not only experience periodic churn, they also increase periodic upsell, which is a situation in which the client increases the contract value every month. Table L shows the effect that different upsell percentages (CR7) have on revenue when combined with changing churn rates.

Table L. Impacts based on changes in upsell (CR7) and churn (C6)
Below is the growth formula for annual recurring revenue value in which the period is 12 months:

Because Customer Acquisition (Stage 1) and Recurring Revenue (Stage 2) are based on different growth formulas, they achieve different impacts on company revenue, as depicted in Figure 12.
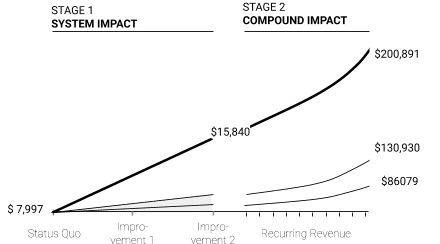
Figure 12. Growth in Stages 1 and 2
Annual vs. Monthly Contracts
The growth formula for annual recurring revenue, known as ARR(Growth), requires companies to distinguish between two very different business models:
Monthly Contracts: For businesses that work on a monthly contract (such as a monthly subscription with an online storage company), churn is about 1 to 2% per month [Ref. 4]. Upsell can vary greatly, though it generally exceeds churn, and the period over which it happens may be anywhere from nine months to several years [Ref. 5]. For B2C examples, consider a monthly phone subscription or monthly Amazon bill, while B2B examples include a company’s storage, monthly leads, etc.

Dashboard Example – Usage MRR: This type of growth is primarily achieved by growing new revenue from existing customers based on usage (examples include companies that provide templates, content, storage, leads, etc.). In this case, businesses can grow a lot faster with the same amount of customers, but in turn, they are more prone to churn, as customers can turn off or downsize their usage overnight. In these types of businesses, revenue churn averages between -1 to -2% per month [Ref. 6]. As shown in Figure 7.13, most of the growth comes from usage/consumption rather than new customer accounts.
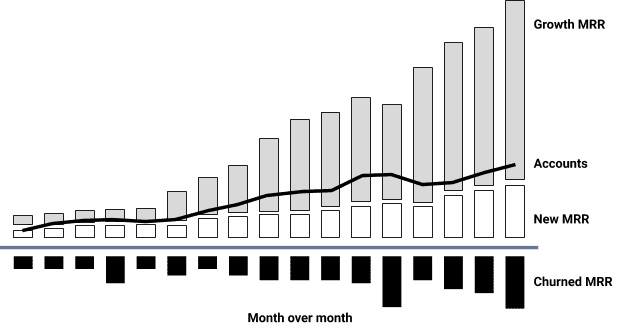
Figure 13. MRR dashboard usage shows most growth comes from usage/consumption
Annual Contracts: Businesses that utilize an annual contract function based on a number of seats. For example, Google Suite, Customer Relationship Management, or Marketing Automation System licenses. For these types of platforms, annual churn is 6 to 7% [Ref. 7]. The upsell is comprised of a lift or increase in the annual platform price, usually by 5 to 10% [Ref. 8] as well as growth due to an increase in the number of seats. In this case, the period is measured by the length of the contract (for example, three years) which is also known as Average Contract Length or ACL.

When you calculate out this formula and then begin to make small improvements, the reduced impact that they have is noticeable, as shown in Table M. This is due to the reduced number of time periods, as they are now being measured in years rather than months.

Table M. Impacts on revenue based on changes in churn, price increase (lift), and growth
Dashboard Example – Annual Contracts: This type of growth is primarily based on securing new revenue from newly acquired accounts and renewing them at an annual increased rate. This growth chart is very common when companies sell a platform for which the price is based on the number of seats, as described above. Although the number of seats may grow, for most companies, it often grows at a relatively small percentage rate [Ref. 9]. Revenue churn for these types of businesses is between +5 to 7% [Ref. 10], but it is often related to Logo churn (the percentage of subscribers that discontinue their subscription) which is -6 to -7% annually. As shown in Figure 14, most of the growth for these platforms comes from additional seats and price increases.
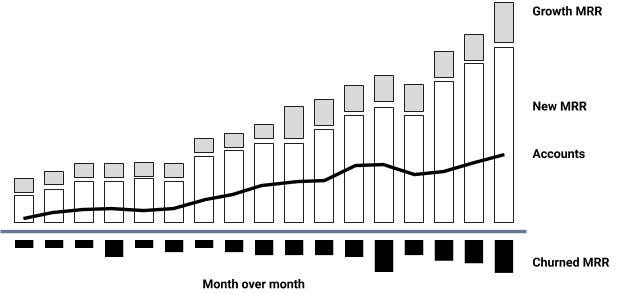
Figure 14. MRR dashboard growth from platforms – most of the growth comes from additional seats and price increase
Stage 3: Extending the Customer Lifetime
Average Contract Length is a time metric that provides a key element for the third and final stage of revenue generation. In this stage, companies should measure the impact created by the length of the customer contract (ACL).
By using the monthly growth formula and measuring the average length of the contract (in this case, p = ACL), you can calculate the expected annual lifetime revenues, known as ARR(LTV). With this formula, companies can determine the impact of increasing the contract length by a single month and then compare it to their previous pipeline. See Table N for the results achieved by increasing the ACL.


Table N. Impacts based on changes in ACL
Extending the customer lifetime has a profound impact on a company’s total revenue. Figure 7.15 displays a comparison of the different impacts achieved across Stages 1, 2, and 3 of revenue generation.
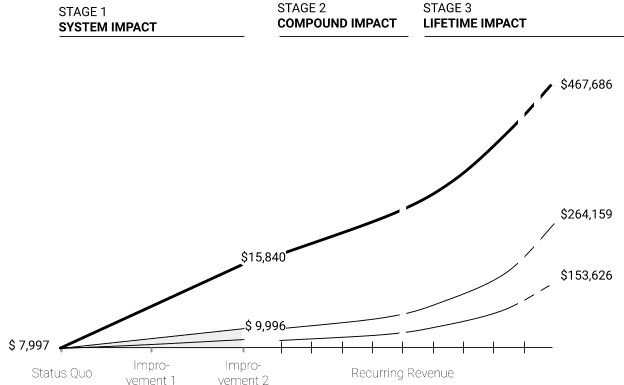
Figure 15. Growth Stages 1, 2, and 3 show pronounced impact based on an extended customer lifetime
he results show that 3x revenue can be generated using the same amount of prospects with a monthly subscription model simply by making small improvements across the entire lifecycle of the customer. The biggest impact, however, occurs post-sale when $15,840 in monthly recurring revenue can be turned into $467,686 of lifetime value. Unfortunately, this is an area where companies commonly spend the least amount of quality resources [Ref. 11].
Such an improvement does not happen through a change in hiring practices, but rather through a shift toward approaching sales as a system and implementing processes that, with small improvements over time, will maximize impact.
A Future Metric: Identifying the Customer Early On
There may also be a need for a fourth growth stage based on the fact that not every customer is created equal. Though there is no formula yet, when a successful business looks back to identify the moment it “took off,” it can typically categorize customers into one of three variants of a symbiotic relationship:
- Mutualism: Relationships in which both parties benefited. This is the lionshare of customers. From the beginning of the relationship, each party was committed to the success of the other. Not much occurred beyond the conveyance of revenue and perhaps the display of a logo on a website.
- Commensalism: In this relationship, the seller clearly benefited, but at no cost to the buyer. Examples of a commensal relationship might include a customer who spread the word about a product by mentioning it was critical to their success, a customer who helped the seller discover a new vertical market, or a customer who invited the seller to speak at an event filled with qualified buyers.
- Parasitism: Relationships in which one party significantly benefited at the cost of the other. Most commonly, it is the seller who benefited from financial gains, whereas the buyer never received the impact they were promised. These accounts often churn at the end of the contract.
The most dangerous relationship for a new company is parasitism camouflaged as commensalism. Many CEOs make the mistake of thinking that a big brand name will act as a force multiplier, but research shows that large multinational customers often cause harm to a seller because they demand the most valuable resources of a company during the critical phase of rapid growth [Ref. 12]. These large customers often require long business trips by founders and knowledge transfers, which are followed only by the RFQ and an invitation to participate in a bidding war.
For this reason, it would be beneficial if companies could recognize up front whether the seller-buyer relationship would result in mutualism, commensalism, or parasitism. With a system based on data in place, this could eventually be a reality. As soon as the system recognizes a specific marketing campaign results in huge success (for example, a SEO term), it could allocate more funds to that SEO term. If the win rate, sales cycle, and average contract value of a vertical market indicates improved effectiveness, it could prioritize lead campaigns or even prioritize SQLs to intensify efforts. This is referred to as a “closed loop system.” Figure 7.16 provides a visual display of sales as a closed loop system.
A closed loop system is a system that regulates itself based on feedback. These types of systems form the basis for every artificial intelligence system in the world. Their implications on sales the world of sales, however, will require much further exploration and research.
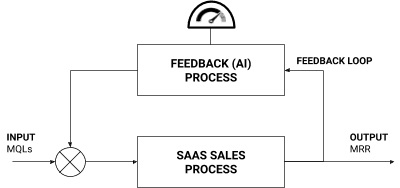
Figure 16. Sales as a closed loop system, a foundation for artificial intelligence
Summary
To get the most value out of data collection, companies should leverage an established data model for recurring revenue generation which provides three kinds of metrics: volume metrics, conversion metrics, time metrics. These metrics dictate three stages of growth:
- Customer Acquisition: This stage generates system impact, which consists of small improvements to the conversion rates across the board to create a bigger overall impact, as opposed to a great impact on a single conversion metric (such as win rate); often person-driven.
Formula: MRR(New)= Prospects n=15CR[n]Monthly Fee
- 2. Recurring Revenue: This stage establishes a recurring revenue stream that creates a compound impact based on churn and upsell metrics. If the impact is felt monthly (versus annually), a more rapid increase or decrease is possible as the impact compounds over the number of periods (p).
Formula:
ARR(Growth)=MRR(New) (1+CR6+CR7)p
- Lifetime Value: The later, post-sale stages of revenue generation, during which exponential growth provides a disproportionate amount of revenue. By extending the average contract length (ACL), a company earns a disproportionate amount of profit.
Formula:
LTV=MRR(New) (1+CR[6]+CR[7])ACL
In many companies, most of the quality and volume of resources are applied to the customer acquisition processes, primarily to two conversion rates (CR2 and CR4). However, a company’s success depends on a system in which profits are generated due to growth of recurring revenue over an increased customer lifetime. In many cases, this is where the least amount of quality resources are applied.

