The data that drives the SaaS methodology model can be categorized into three types: volume metrics, conversion metrics, and absolute time metrics. Each of these work in systems to drive the different stages of revenue generation: customer acquisition, recurring revenue, and lifetime value.
Measuring Data
Many organizations are excited about the amount of data flowing into their customer relationship management (CRM) or marketing automation systems (MAS). Despite the influx of data, however, many organizations are also uncertain how to interpret and best utilize it. There is a tendency to compare apples to oranges, which results in either no action or bad action which has an adverse impact on the business.
Most decisions in sales today are guided by data, so a company must establish the correct data model for itself. Companies must ensure they are measuring from the same point and comparing against the same criteria in the same way. Start by standardizing exactly what your company is going to measure.
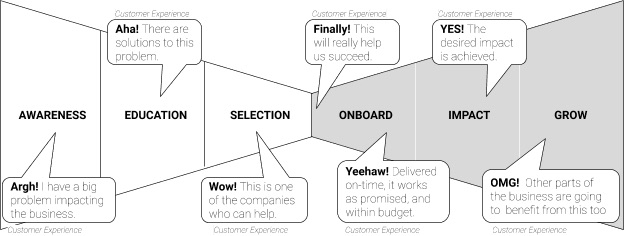
Figure 1. The Recurring Revenue Model
The SaaS Methodology Data Model
The Recurring Revenue Model is a customer-centric model based on seven unique customer experiences during the stages of the sales cycle, as shown in Figure 1 above, and it is the backbone of SaaS Methodology. There are three types of metrics that contribute to the SaaS Methodology data model:
- Volume Metrics. These will measure how much volume, such as leads, deals, etc., your company has.
- Conversion Metrics. These will measure how many inputs are needed to generate the desired output.
- Absolute Time Metrics. These measure how long it takes to convert input into output.
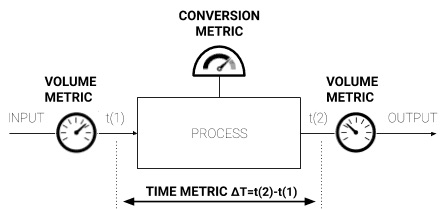
Figure 2. The SaaS Methodology is a scientific model that uses three types of metrics
Volume Metrics
Volume metrics are quantities of items (such as the number of leads, commits, or revenue) present or generated at any given step in the sales process. See Figure 3 and Table A for the different volume metrics and their respective definitions.
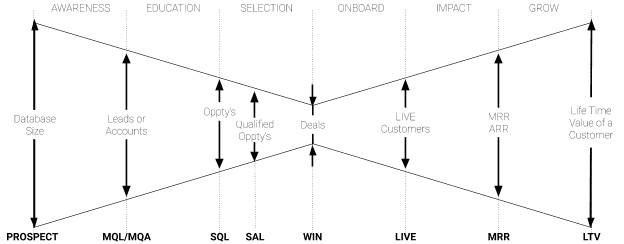
Figure 3. Volume metrics throughout the sales process
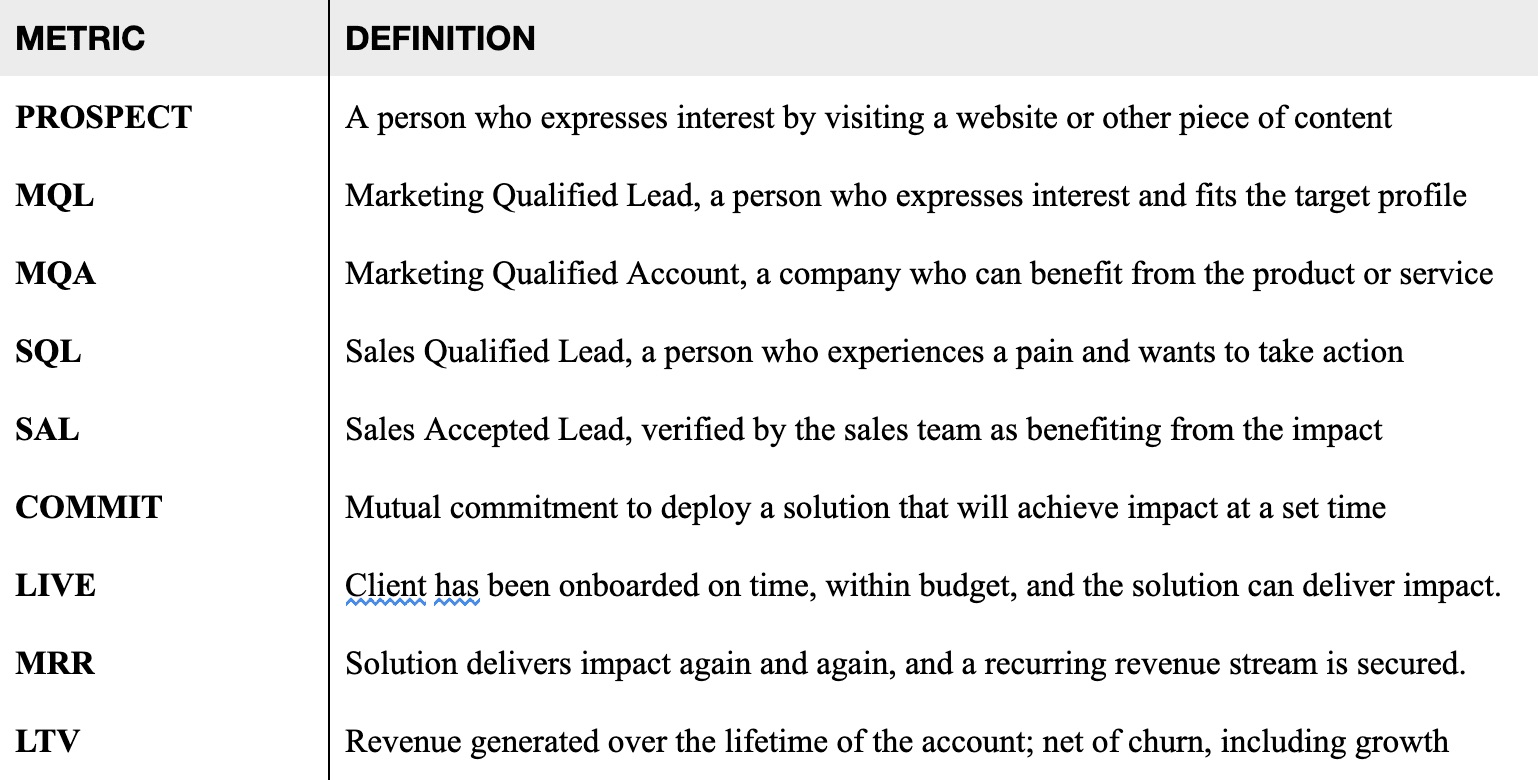
Table A. Volume metrics defined
The Order of SQLs vs. SALs
The typical diagram of a Sales Qualified Lead (SQL) in a sales funnel will depict a process whereby marketing delivers Sales Accepted Leads (SALs) and then sales qualifies them as SQLs. This is the wrong order. In sales, you should qualify first and then accept. When sales accepts a lead, it is held accountable for the win rate and the sales cycle. See Figure 4 for a visual representation of the correct order. To clarify the process, the figure uses an emergency room visit as an example because hospitals are analogous in that they expand the quantity and quality of resources based on the diagnosis. Table B shows questions to ask at each step of the sales process.
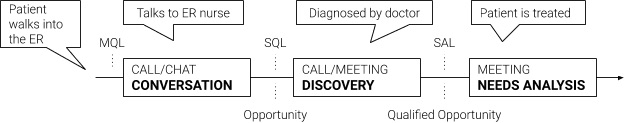
Figure 4. Correct depiction of Sales Qualified Lead before Sales Accepted Lead
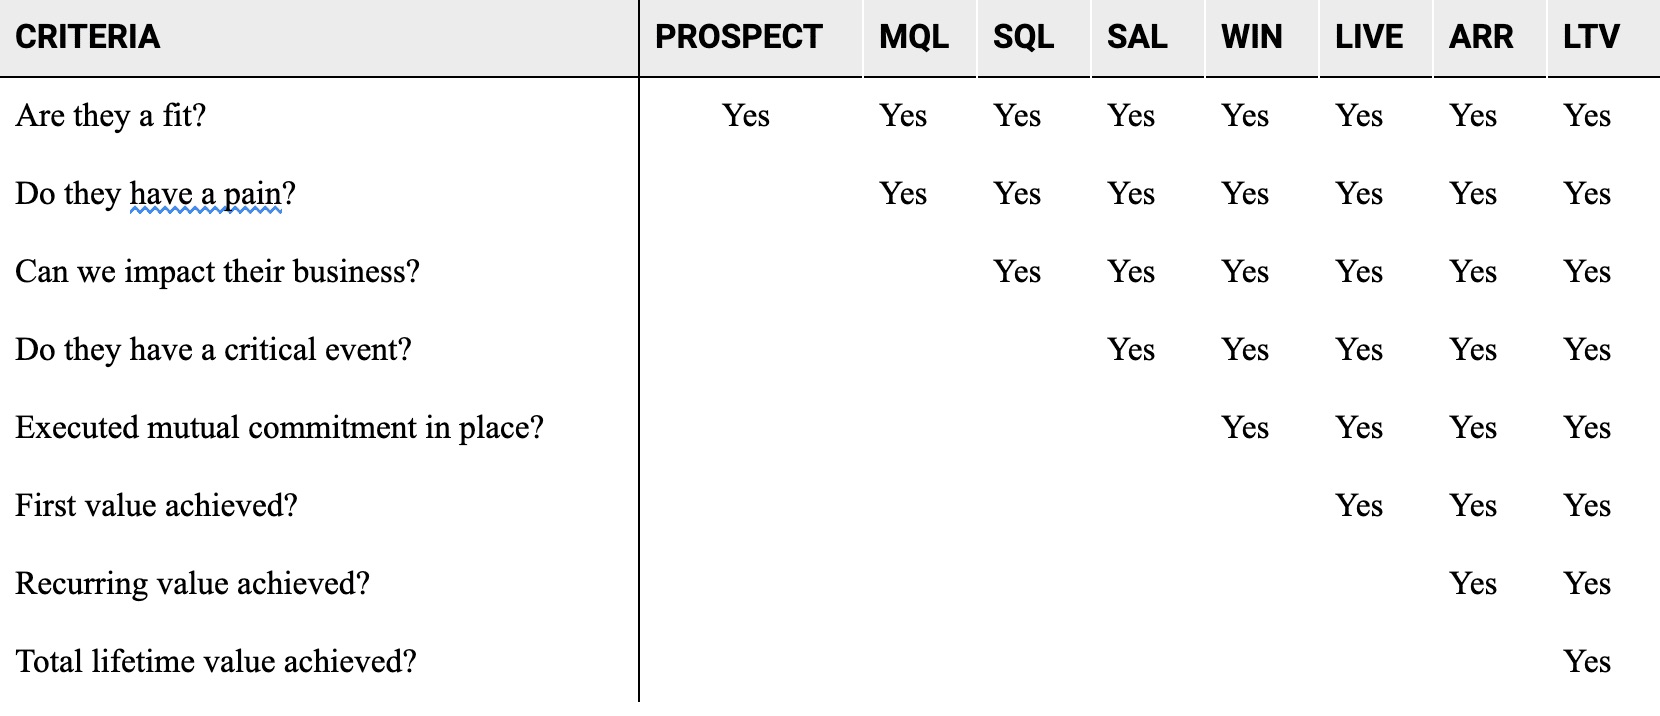
Table B. Questions to ask at each stage of the process
Conversion Metrics
Conversion metrics measure the volume of the output of a process divided by the volume at input. They indicate the rate at which you are converting at each step. See Figure 5 and Table C for conversion metrics throughout the sales process and their respective definitions.
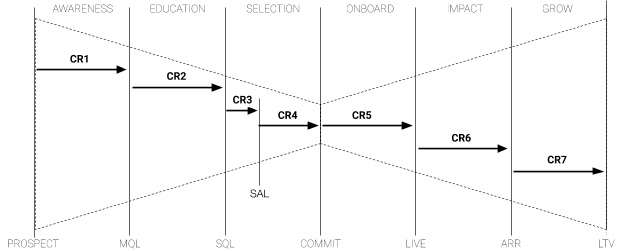
Figure 7.5 Conversion metrics throughout the sales process
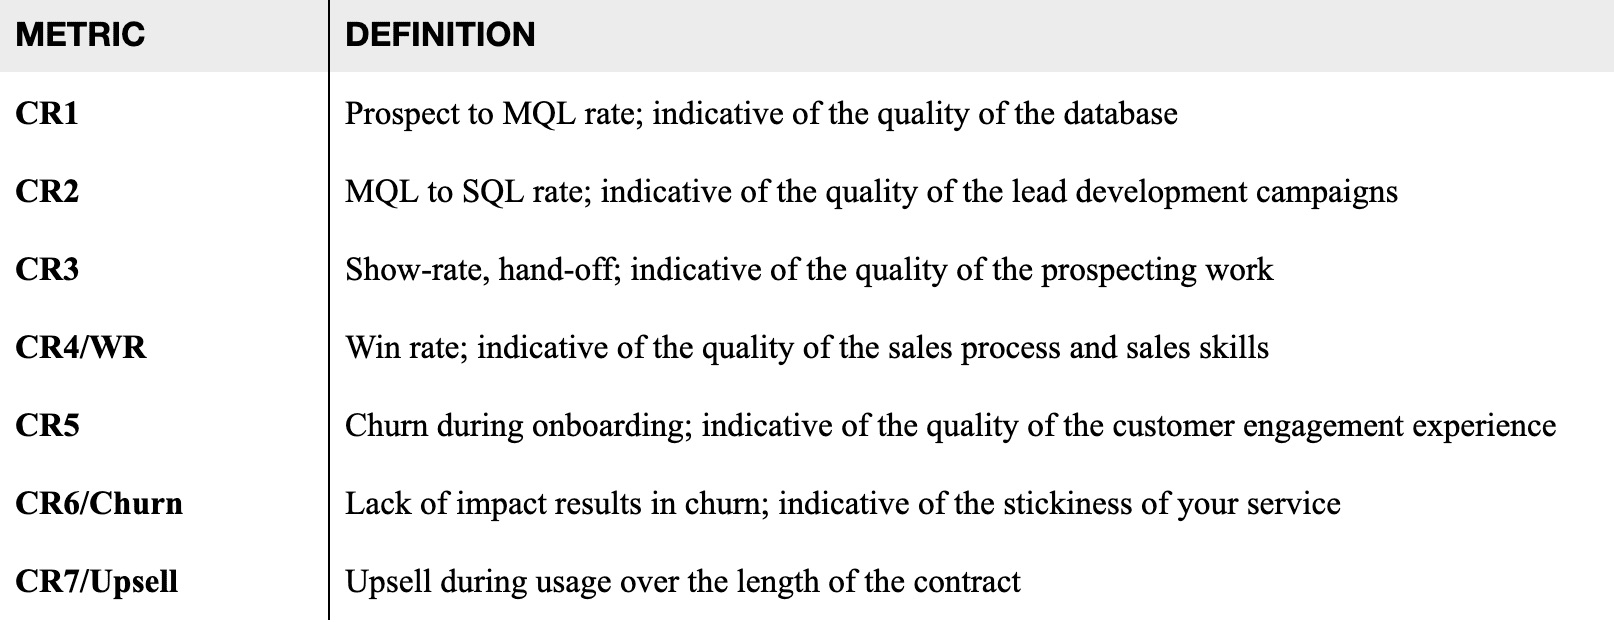
Table C. Conversion Metrics defined
The Importance of CR3 and CR4
When looking at the conversion rates, CR3 and CR4 stand out. CR3 refers to how many meetings were set for the sales team versus how many of those turned into an opportunity (also known as the sales pipeline). There are two reasons why this is not 100%. First, there are no-shows, or prospects who commit to a meeting to get you off the phone but do not show up to the meeting. Second, there are unqualified leads, or prospects who upon further review cannot be helped by the company’s product at this time.
In the case of a two-stage organization, the prospector (SDR) had a short conversation with the client who agreed to a discovery call with the sales manager or account executive (AE). CR3 and CR4 (win rate) are particularly important as they provide insights into team efficacy and where it can be improved. See Table D for suggestions based on these two conversion metrics.
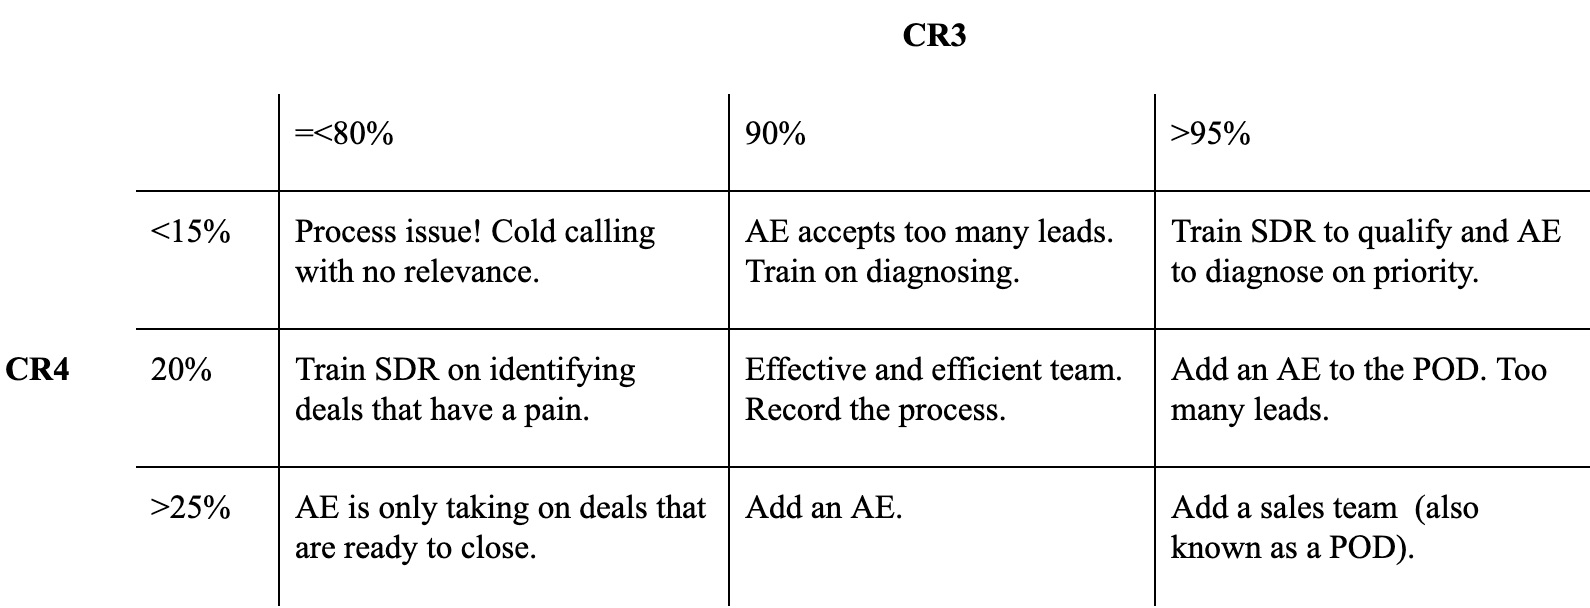
Table D. How CR3 and CR4 conversion metrics can diagnose sales issues
Absolute Time Metrics
Absolute time metrics are defined as the delta in the time it takes to convert one volume metric into another volume metric. See Figure 6 and Table E for absolute time metrics throughout the sales process and their respective definitions. The length of time it takes to convert one metric into another is determined not by the actual activity in the process but by the waiting time in between the processes. For example, it may take five minutes to write an email invitation to an event, but it can take days to get a response.
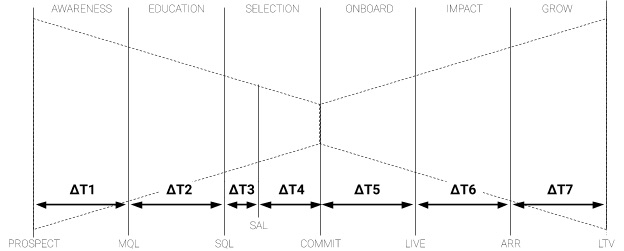
Figure 6. Absolute time metrics through the sales process
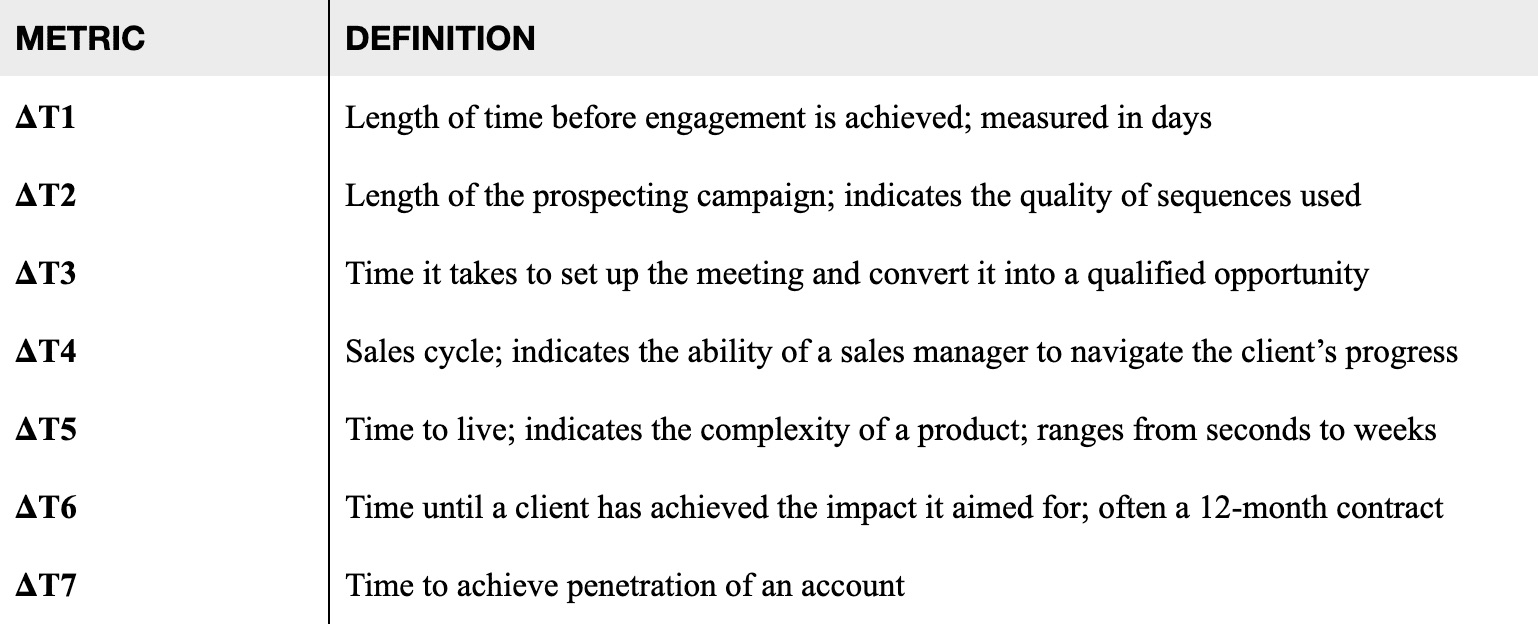
Table E. Absolute time metrics defined
Fast Response Times Can Backfire
One of the most common marketing mishaps involves an inbound lead or MQL. When a client reaches out, they generally have a pain that motivated them to do so. In that first conversation, the seller should make sure they are fit before scheduling a discovery/demo call. An inbound call is time sensitive, and the faster the response, the higher the chance of a successful outcome.
Viewing it from the buyer’s perspective, they have finally found the product they want to purchase but they cannot get it until they “talk to someone” on the seller’s side. They leave their phone number, enter their email address, and wait for some to contact them. B2C metrics say that the majority of people spend five minutes (at most) waiting for a response or checking their inbox for a reply [Ref. 1].
Drift, a company that specializes in customer web chat, performed research which showed that as of mid-2018, only 7% of 433 companies contacted responded within five minutes. Even worse, 55% of the companies did not respond within five business days [Ref. 2].
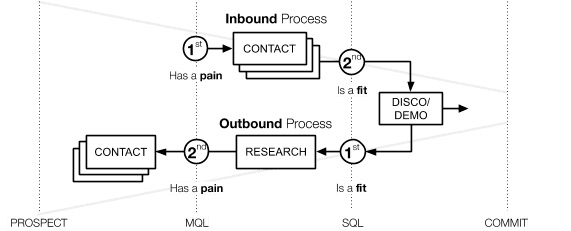
Figure 7. Inbound vs. outbound processes: fit and pain are reversed, causing the wrong, time-sensitive response
In general, an inbound process consists of a series of actions such as sending an email, making a phone call, and leaving a voicemail. As an example, many people experience this process when reaching out to a dentist.
However, this time-sensitive process is often used in the wrong circumstances. For instance, if a client provides an email address so that they can download a research paper from your website, in many cases, this lead will be miscategorized as an MQL. As a response, the sales development rep calls the prospect immediately, leaves a voicemail, and sends a follow-up email as if the client has expressed a pain – but they never did. Now, the client feels intimidated by the assertive follow-up.
Companies must learn that not every MQL is created equal. In this case, the MQL should have gone into the outbound process, during which research would have been performed to determine if this client had a pain the company could solve. See Table F for more examples of true inbound leads compared to quasi-inbound leads.
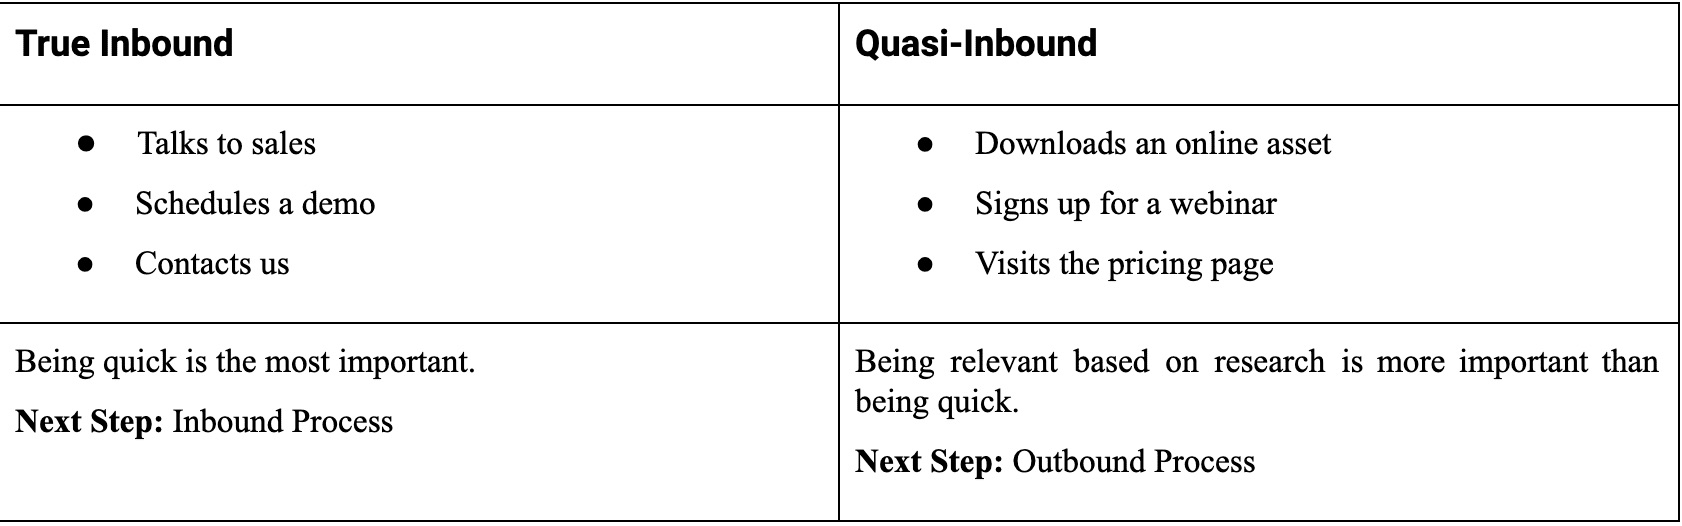
Table F. Examples of true- and quasi-inbound leads and appropriate responses
Sales as a Science
All sales leaders have been in situations where their sales team is falling short of its targets. In that circumstance, most tend to respond by thinking about how many more deals they must add to meet that target. The more sophisticated among them may also consider how many more incremental meetings, sales opportunities, or marketing qualified leads they need in order to achieve that goal. In other words, most sales leaders are thinking in additive terms, which is a result of each department working by itself with an individual additive goal. This is more commonly referred to as “operating in silos.”
Generating revenue is not a one-time event that happens in one meeting, performed by a single person. Rather, revenue is the product of connected events across a series of meetings, working together in a system that is run by several people. This system is based on connected revenue propulsion systems that operate during three different stages:
- Stage 1: Acquire Customers
- Stage 2: Achieve Recurring Revenue
- Stage 3: Extend the Customer Lifetime
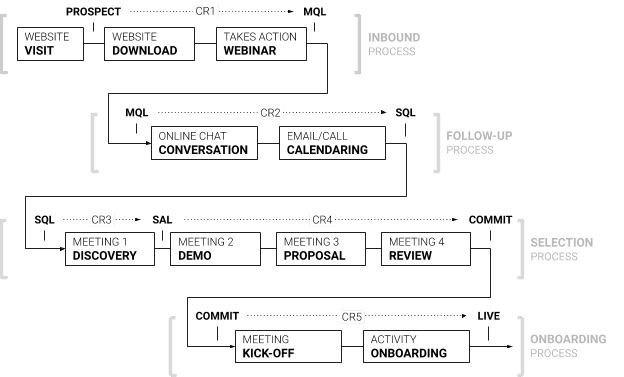
Figure 8. Example of the Acquisition Process: a series of activities form the processes that work together as a system
Stage 1: Customer Acquisition & System Impact
During customer acquisition, there are typically four different processes at play, as depicted below in Figure 9. Each process is based on a series of interactions, and each of these interactions has a conversion. The end result of the entire Customer Acquisition process is the product of these conversion rates (CR).
For a practical example that illustrates these processes, consider a high-velocity prospect who visits your company website. Following some browsing, she likes a white paper and enters her email address to gain access. As she is reading the paper, she receives an invitation to attend a webinar with an expert in the field. She signs up for the webinar, and with that action, she becomes an MQL. Unfortunately, she is unable to attend the webinar.
The day of the webinar, she goes back to the website where a chatbot welcomes her back. The chatbot knows she was unable to attend and asks if she would like to watch the recording. She likes this idea and watches the condensed version of the webinar. The chatbot then asks if she wants to set up a discovery call. She says yes and is linked to a live chat with Mike, the SDR. Mike learns her name is Nikki and suggests a few time slots to meet. Nikki picks a time and receives confirmation via email. She has now become a SQL.
The next day, Nikki dials into the discovery call where Mike introduces her to Yuri, the AE. Yuri diagnoses Nikki and concludes the company can help her. She has now become a SAL. Yuri suggests a real-time demonstration. Nikki loves the demo and asks for the price. Yuri offers a range of prices based on her exact needs, and together they hone in on their options. Nikki asks for a proposal so she can take it to her organization. A few days later, both parties meet to review the proposal. Nikki has invited the VP of Finance who seeks agreement on a few terms.
The next day, the agreement is executed, and a kick-off is scheduled. During the kick-off, Nikki adds the Director of Sales Ops who integrates the service into their cloud suite. On Monday, she and her team are live.
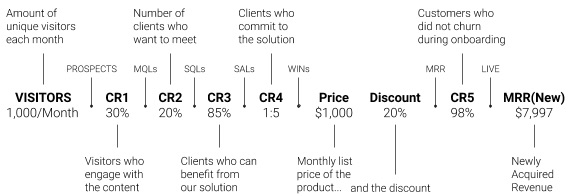
Figure 9. High-velocity sales based on web visitors
How to Calculate Acquired Monthly Recurring Revenue
Figure 9 displays the steps that prospects – who begin as website visitors – progress through during the sales process. These steps are accompanied by sample conversion rates, prices, and discounts that a company might achieve or create during the Customer Acquisition stage. The formula for calculating Monthly Recurring Revenue, known as MRR(New), based on website traffic is as follows:
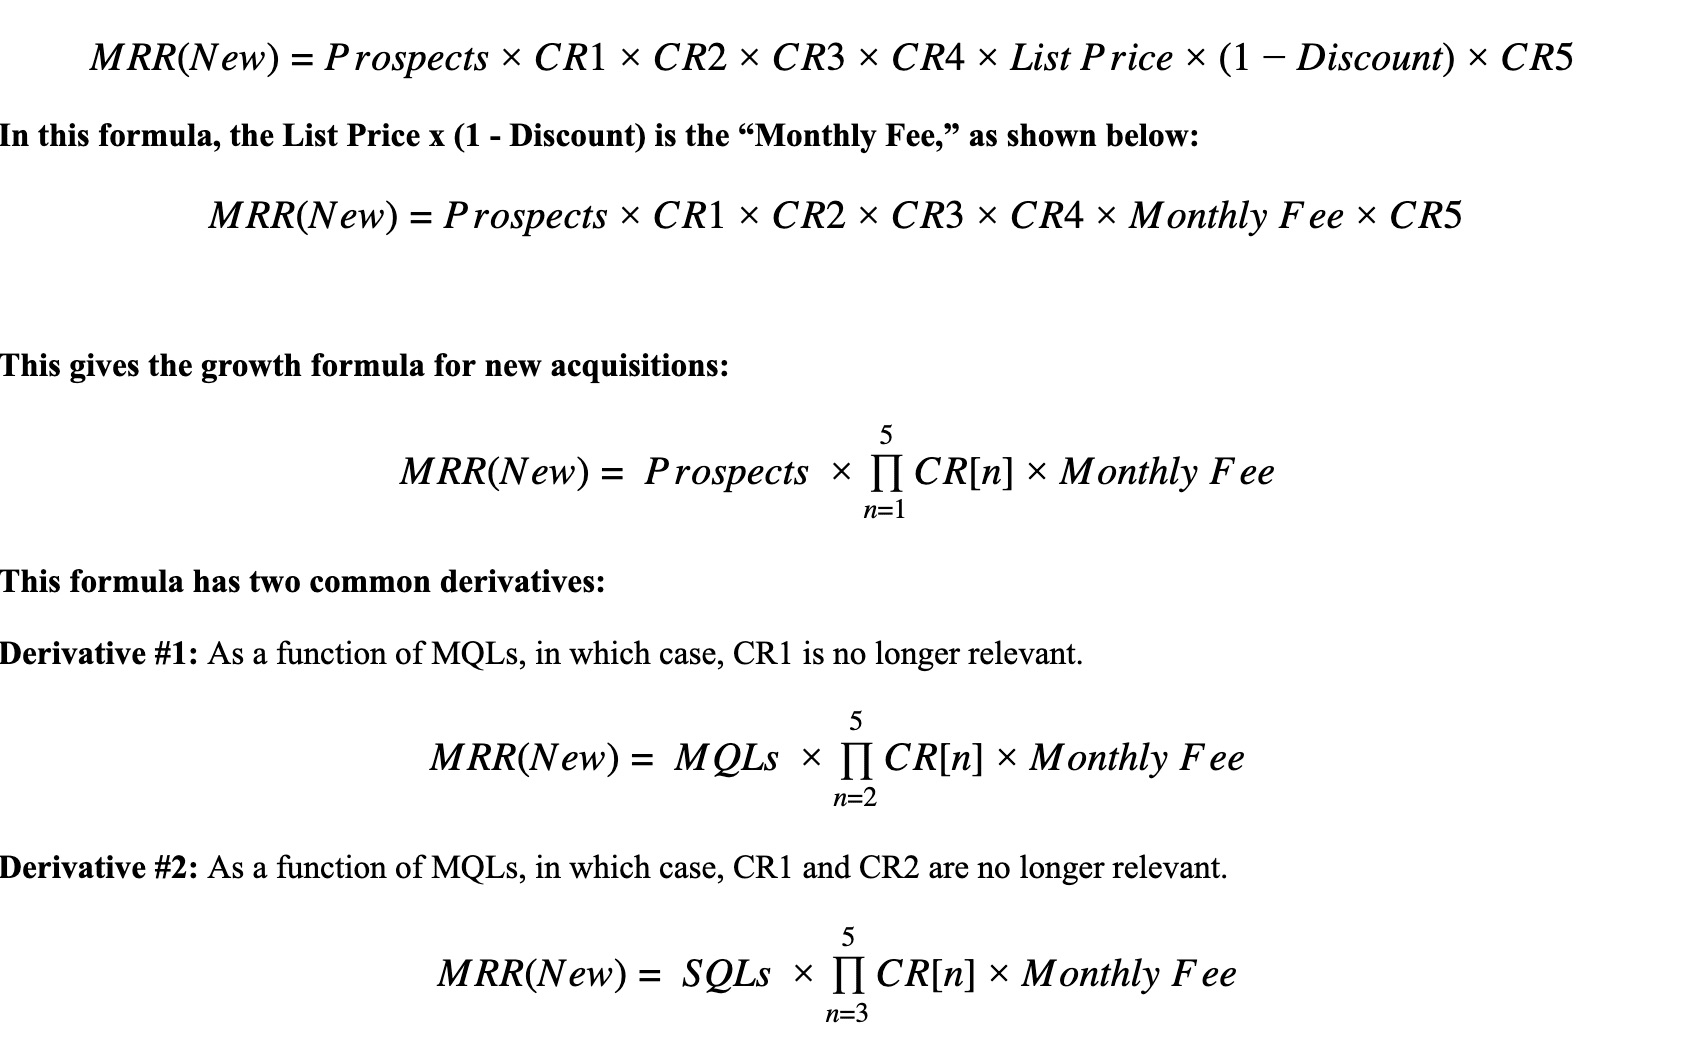
By improving the performance of each conversion rate independently, the impact on newly acquired Monthly Recurring Revenue can be measured. Table G below demonstrates the impact of improving a single conversion rate, CR2, on MRR(New). This example is based on 1,000 prospects. CR2 is the conversion rate between MQL and SQL, which is the result of a call or email by a sales development rep in a high velocity sale.
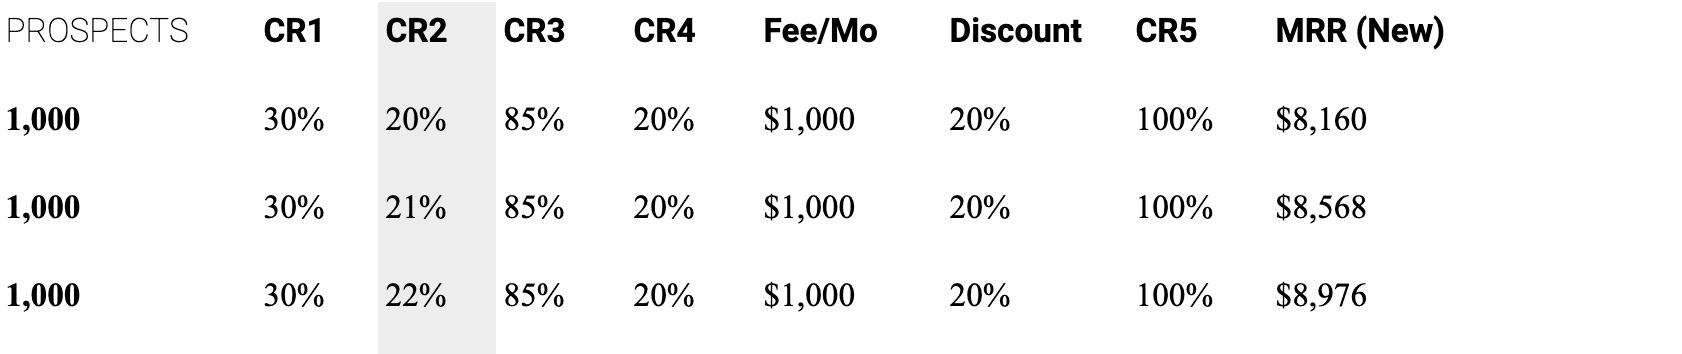
Table G. Change in MRR(New) as CR2 increases
With this single percentage point improvement, the impact on MRR(New) is five percent. As an example, such an increase in performance could be the result of the use of an online chatbot. However, not every improvement creates the same results. Some improvements impact results in a much larger way. For example, with win rate and discount, their impacts are greater as they occur within a much smaller data set.
Win Rate: In sales, there has been a big change in win rate since the once-standard 1 in 3 of Enterprise Selling. Today, the average performance is about 1 in 5, with the best in class operating at a win rate of 1 in 4 [Ref. 3]. See Table H as an example of the effect that an increased win rate (C4) has on new Monthly Recurring Revenue.
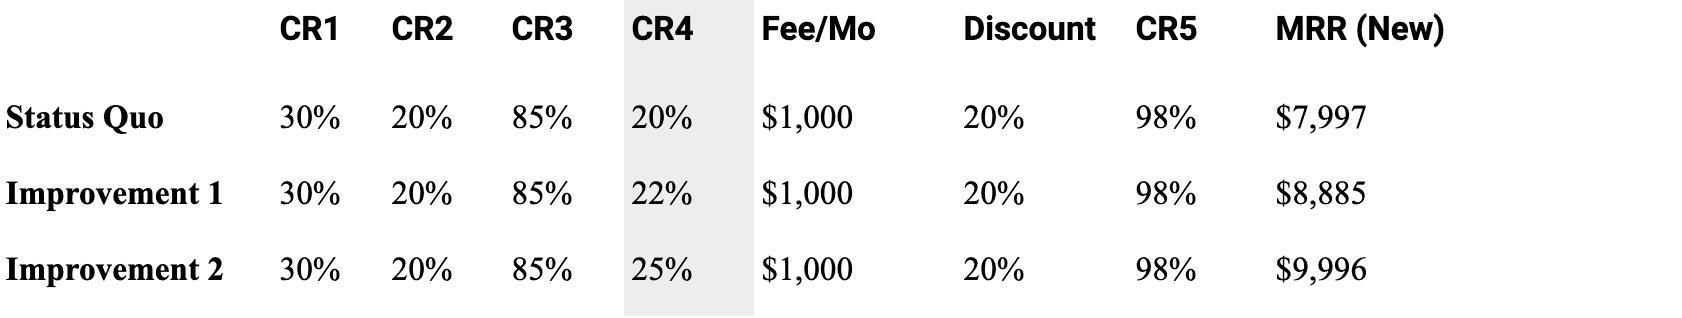
Table H. Change in new MRR(New) as CR4 (win rate) increases
Discount: Recurring revenue models were never designed for discounts. In a way, compared to the previously used Perpetual Business Model, they are already the discount model. To make matters worse, many companies have fallen into the habit of discounting prices at a set rate of 10% or 20%. Large increases in discount levels have a pronounced negative impact on the new Monthly Recurring Revenue generated by the company. Table I provides an example.
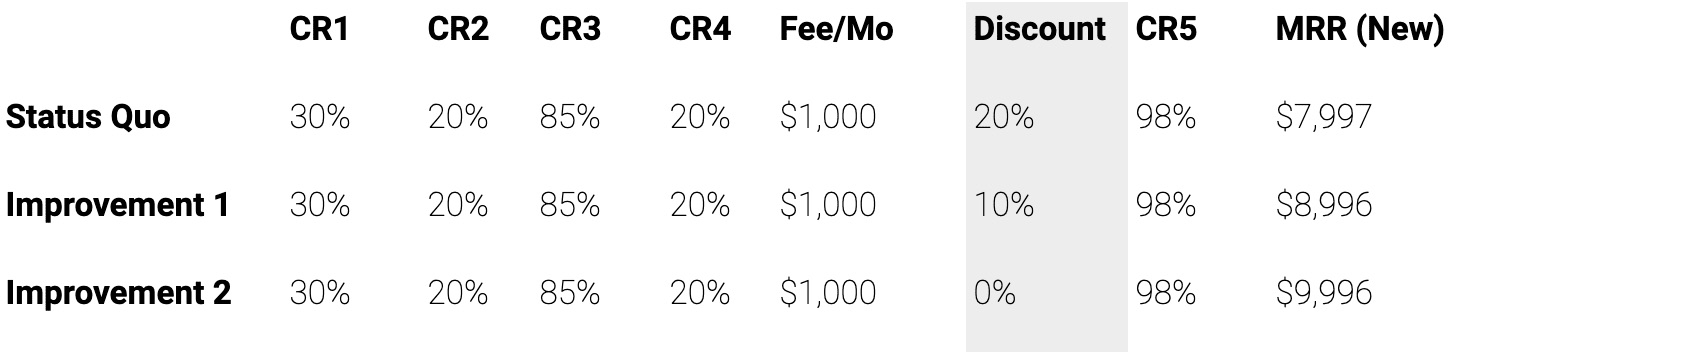
Table I. Change in MRR(New) as discount decreases
As you can see from these results, in terms of individual conversion rates, win rate and discount level have the most pronounced impact on newly acquired Monthly Recurring Revenue. This impact is displayed in Figure 7.8 below.
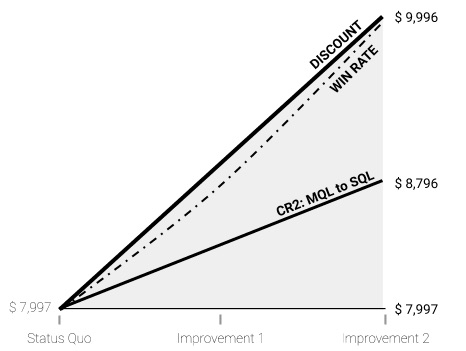
Figure 10. Discount level and win rate impact on MRR(New)
System Impact: Small Changes Equal Big Results
In this cohesive system which is impacted by a series of conversion metrics, the major realization and actionable lesson for companies is this: When you improve each conversion metric by just a small amount, the recurring revenue stream nearly doubles, even when using the same number of prospects (1,000). This is known as “system impact,” and the results can be seen in Table J and Figure 11.
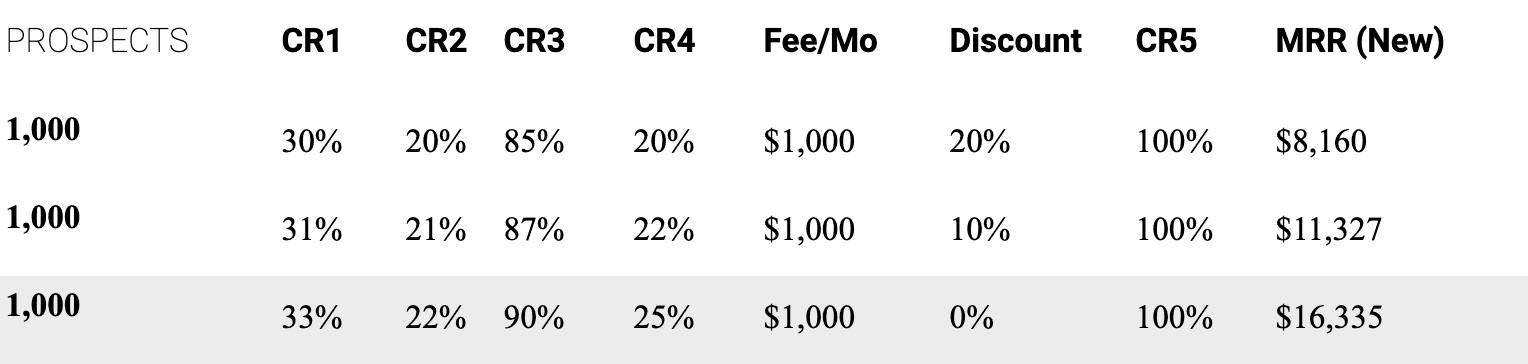
Table J. Results of incremental changes in conversion rates (CR) on MRR(New)
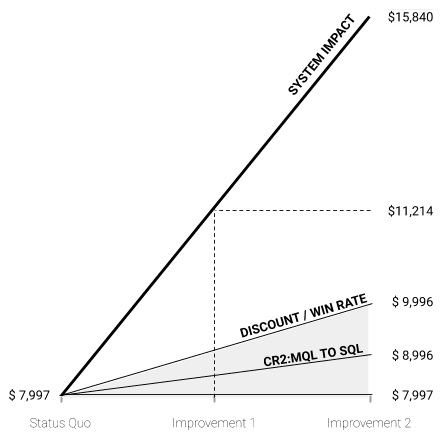
Figure 11. System impact shows small improvements result in 2x MRR(New)
At the system level, revenue organizations work multiplicatively rather than additively. The effort and results of each link in the sales chain are magnified or diluted by the next. Therefore, massive changes in outcomes are possible by making marginal improvements across the chain rather than by simply improving any one link.
Despite this fact, most sales leaders are of the mentality that they could not improve sales by 2x without increasing the top of the funnel, but they would likely sign up to improve their discovery call conversion rate by 10%.
Stage 2: Recurring Revenue & Compound Impact
After learning how to double the recurring revenue stream with incremental changes, companies should next focus on creating a compound impact from their revenue using Churn and Upsell metrics. The following examples begin with a monthly model and proceed to an annual model.
Churn: In the Recurring Revenue stage, not every customer comes back. This is normal, and it is referred to as “churn” (CR6). Unlike the Customer Acquisition stage of business, this stage experiences a different growth formula, which is used in nearly all areas of finance, known as Future Value (FV).
FV incorporates a compound element based on a period(s) of the interval measured over time, as follows
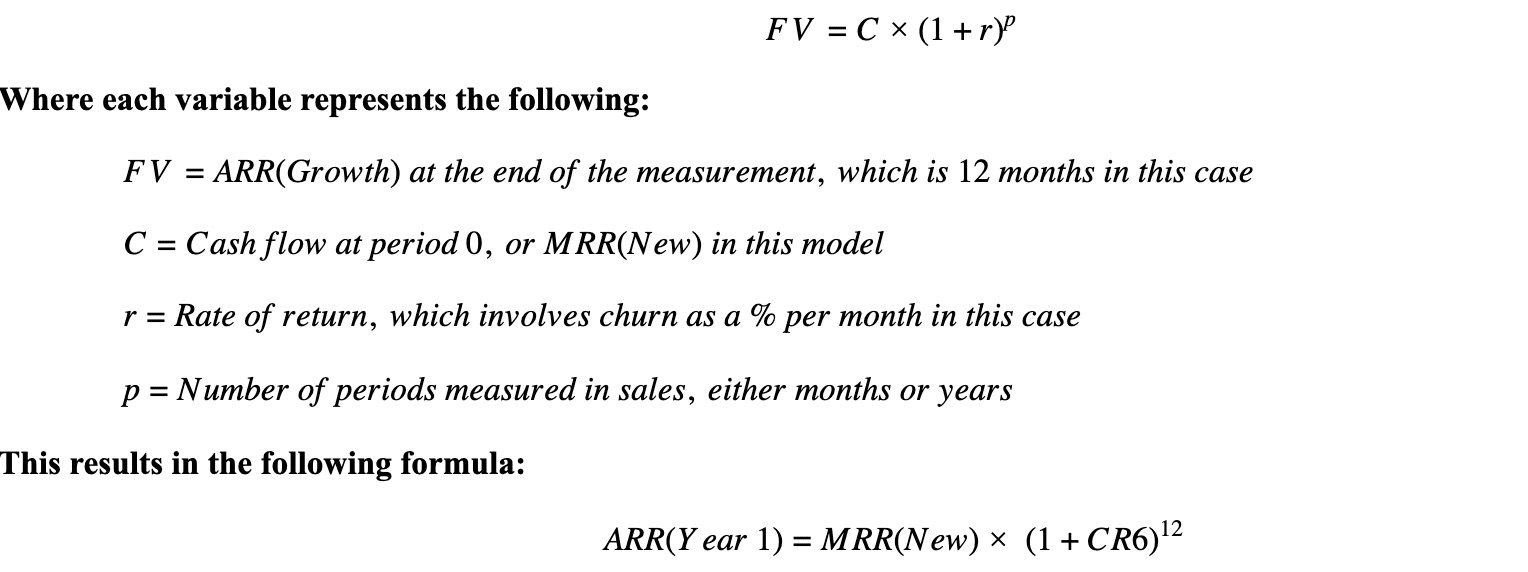
Table K shows the impacts of periodic churn on revenue based on a 12-month contract:
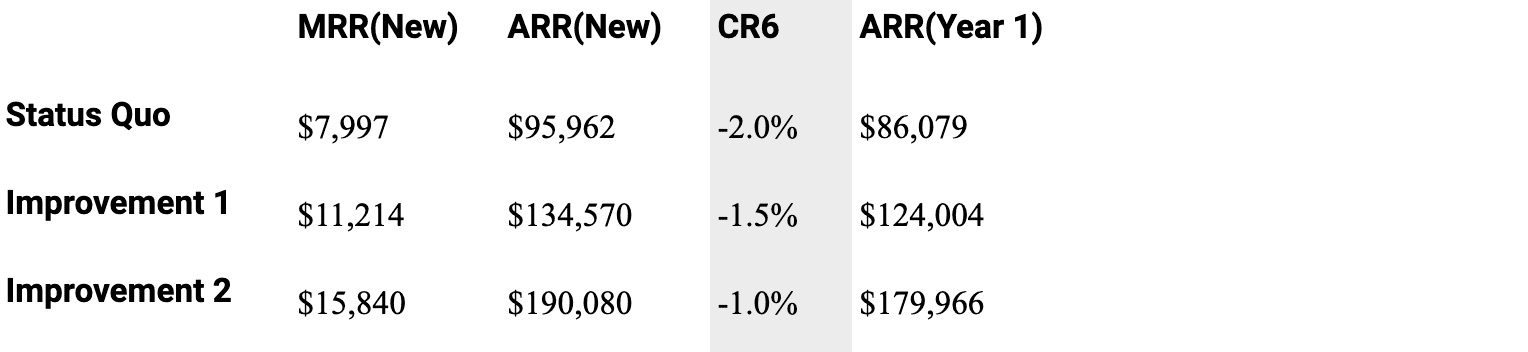
Table K. Impacts on revenue based on changes in churn rates (CR6)
Upsell: Companies not only experience periodic churn, they also increase periodic upsell, which is a situation in which the client increases the contract value every month. Table L shows the effect that different upsell percentages (CR7) have on revenue when combined with changing churn rates.
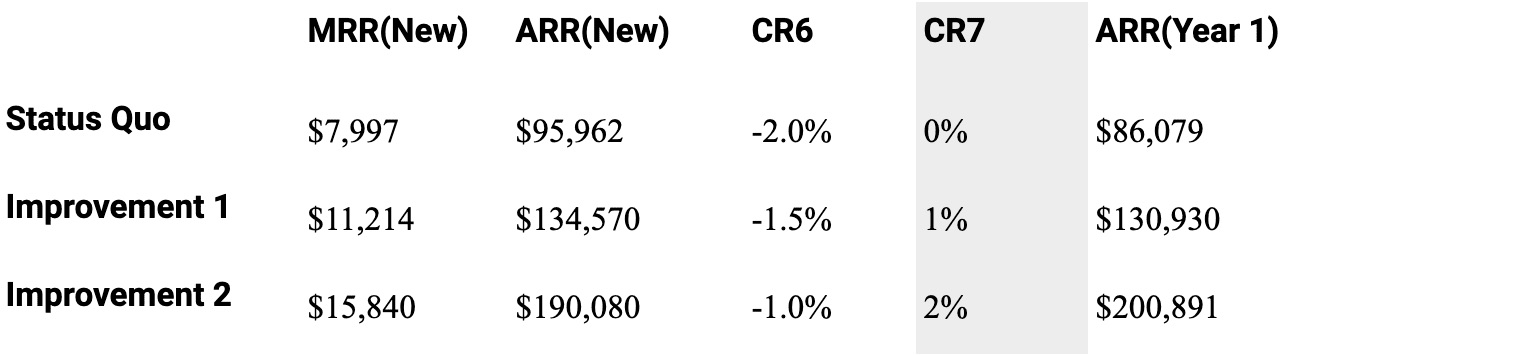
Table L. Impacts based on changes in upsell (CR7) and churn (C6)
Below is the growth formula for annual recurring revenue value in which the period is 12 months:

Because Customer Acquisition (Stage 1) and Recurring Revenue (Stage 2) are based on different growth formulas, they achieve different impacts on company revenue, as depicted in Figure 12.
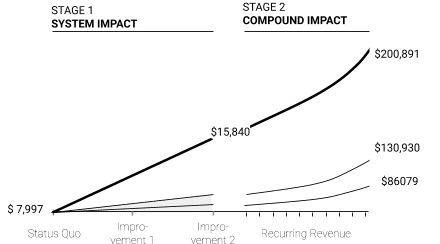
Figure 12. Growth in Stages 1 and 2
Annual vs. Monthly Contracts
The growth formula for annual recurring revenue, known as ARR(Growth), requires companies to distinguish between two very different business models:
Monthly Contracts: For businesses that work on a monthly contract (such as a monthly subscription with an online storage company), churn is about 1 to 2% per month [Ref. 4]. Upsell can vary greatly, though it generally exceeds churn, and the period over which it happens may be anywhere from nine months to several years [Ref. 5]. For B2C examples, consider a monthly phone subscription or monthly Amazon bill, while B2B examples include a company’s storage, monthly leads, etc.

Dashboard Example – Usage MRR: This type of growth is primarily achieved by growing new revenue from existing customers based on usage (examples include companies that provide templates, content, storage, leads, etc.). In this case, businesses can grow a lot faster with the same amount of customers, but in turn, they are more prone to churn, as customers can turn off or downsize their usage overnight. In these types of businesses, revenue churn averages between -1 to -2% per month [Ref. 6]. As shown in Figure 7.13, most of the growth comes from usage/consumption rather than new customer accounts.
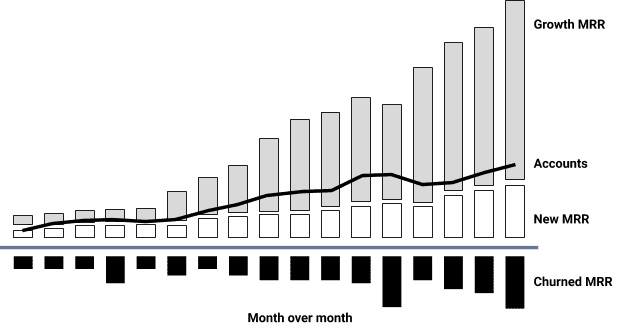
Figure 13. MRR dashboard usage shows most growth comes from usage/consumption
Annual Contracts: Businesses that utilize an annual contract function based on a number of seats. For example, Google Suite, Customer Relationship Management, or Marketing Automation System licenses. For these types of platforms, annual churn is 6 to 7% [Ref. 7]. The upsell is comprised of a lift or increase in the annual platform price, usually by 5 to 10% [Ref. 8] as well as growth due to an increase in the number of seats. In this case, the period is measured by the length of the contract (for example, three years) which is also known as Average Contract Length or ACL.

When you calculate out this formula and then begin to make small improvements, the reduced impact that they have is noticeable, as shown in Table M. This is due to the reduced number of time periods, as they are now being measured in years rather than months.
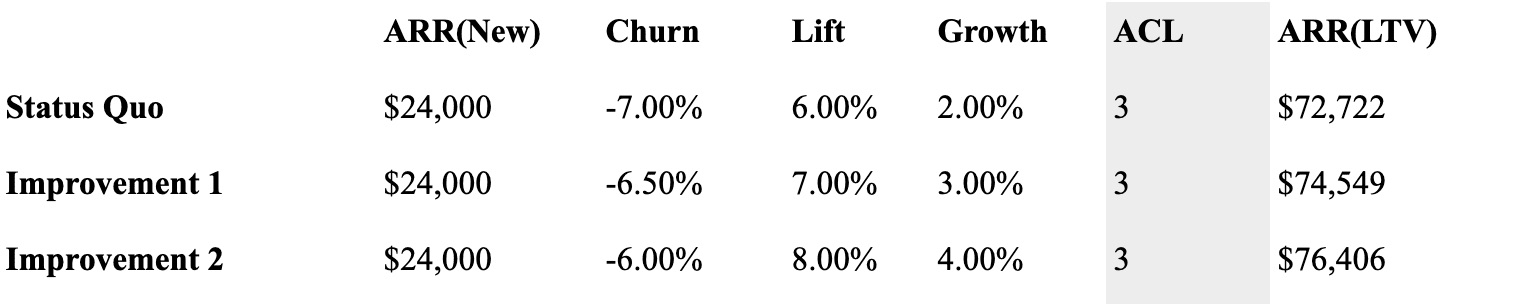
Table M. Impacts on revenue based on changes in churn, price increase (lift), and growth
Dashboard Example – Annual Contracts: This type of growth is primarily based on securing new revenue from newly acquired accounts and renewing them at an annual increased rate. This growth chart is very common when companies sell a platform for which the price is based on the number of seats, as described above. Although the number of seats may grow, for most companies, it often grows at a relatively small percentage rate [Ref. 9]. Revenue churn for these types of businesses is between +5 to 7% [Ref. 10], but it is often related to Logo churn (the percentage of subscribers that discontinue their subscription) which is -6 to -7% annually. As shown in Figure 14, most of the growth for these platforms comes from additional seats and price increases.
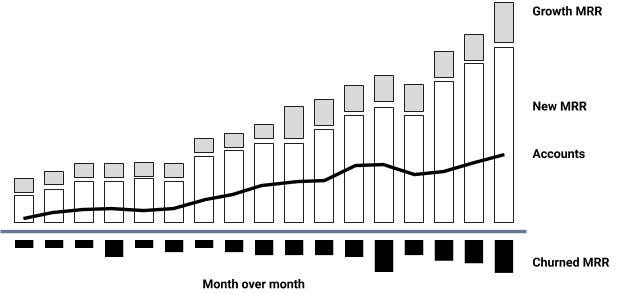
Figure 14. MRR dashboard growth from platforms – most of the growth comes from additional seats and price increase
Stage 3: Extending the Customer Lifetime
Average Contract Length is a time metric that provides a key element for the third and final stage of revenue generation. In this stage, companies should measure the impact created by the length of the customer contract (ACL).
By using the monthly growth formula and measuring the average length of the contract (in this case, p = ACL), you can calculate the expected annual lifetime revenues, known as ARR(LTV). With this formula, companies can determine the impact of increasing the contract length by a single month and then compare it to their previous pipeline. See Table N for the results achieved by increasing the ACL.

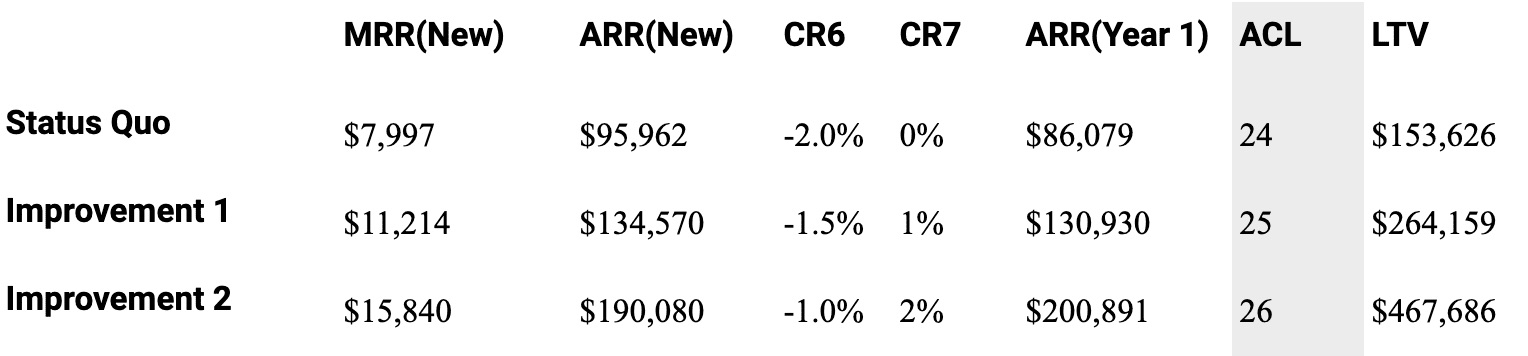
Table N. Impacts based on changes in ACL
Extending the customer lifetime has a profound impact on a company’s total revenue. Figure 7.15 displays a comparison of the different impacts achieved across Stages 1, 2, and 3 of revenue generation.
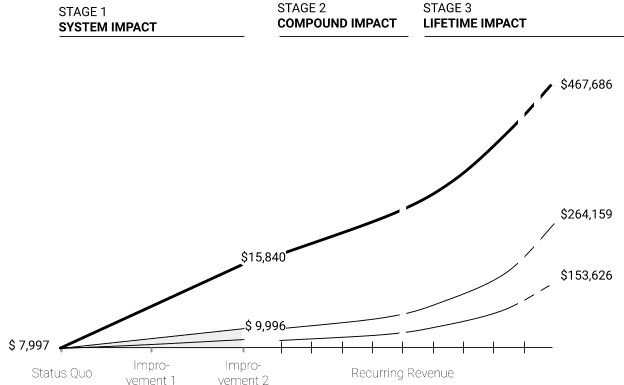
Figure 15. Growth Stages 1, 2, and 3 show pronounced impact based on an extended customer lifetime
he results show that 3x revenue can be generated using the same amount of prospects with a monthly subscription model simply by making small improvements across the entire lifecycle of the customer. The biggest impact, however, occurs post-sale when $15,840 in monthly recurring revenue can be turned into $467,686 of lifetime value. Unfortunately, this is an area where companies commonly spend the least amount of quality resources [Ref. 11].
Such an improvement does not happen through a change in hiring practices, but rather through a shift toward approaching sales as a system and implementing processes that, with small improvements over time, will maximize impact.
A Future Metric: Identifying the Customer Early On
There may also be a need for a fourth growth stage based on the fact that not every customer is created equal. Though there is no formula yet, when a successful business looks back to identify the moment it “took off,” it can typically categorize customers into one of three variants of a symbiotic relationship:
- Mutualism: Relationships in which both parties benefited. This is the lionshare of customers. From the beginning of the relationship, each party was committed to the success of the other. Not much occurred beyond the conveyance of revenue and perhaps the display of a logo on a website.
- Commensalism: In this relationship, the seller clearly benefited, but at no cost to the buyer. Examples of a commensal relationship might include a customer who spread the word about a product by mentioning it was critical to their success, a customer who helped the seller discover a new vertical market, or a customer who invited the seller to speak at an event filled with qualified buyers.
- Parasitism: Relationships in which one party significantly benefited at the cost of the other. Most commonly, it is the seller who benefited from financial gains, whereas the buyer never received the impact they were promised. These accounts often churn at the end of the contract.
The most dangerous relationship for a new company is parasitism camouflaged as commensalism. Many CEOs make the mistake of thinking that a big brand name will act as a force multiplier, but research shows that large multinational customers often cause harm to a seller because they demand the most valuable resources of a company during the critical phase of rapid growth [Ref. 12]. These large customers often require long business trips by founders and knowledge transfers, which are followed only by the RFQ and an invitation to participate in a bidding war.
For this reason, it would be beneficial if companies could recognize up front whether the seller-buyer relationship would result in mutualism, commensalism, or parasitism. With a system based on data in place, this could eventually be a reality. As soon as the system recognizes a specific marketing campaign results in huge success (for example, a SEO term), it could allocate more funds to that SEO term. If the win rate, sales cycle, and average contract value of a vertical market indicates improved effectiveness, it could prioritize lead campaigns or even prioritize SQLs to intensify efforts. This is referred to as a “closed loop system.” Figure 7.16 provides a visual display of sales as a closed loop system.
A closed loop system is a system that regulates itself based on feedback. These types of systems form the basis for every artificial intelligence system in the world. Their implications on sales the world of sales, however, will require much further exploration and research.
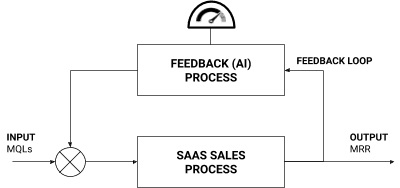
Figure 16. Sales as a closed loop system, a foundation for artificial intelligence
Summary
To get the most value out of data collection, companies should leverage an established data model for recurring revenue generation which provides three kinds of metrics: volume metrics, conversion metrics, time metrics. These metrics dictate three stages of growth:
- Customer Acquisition: This stage generates system impact, which consists of small improvements to the conversion rates across the board to create a bigger overall impact, as opposed to a great impact on a single conversion metric (such as win rate); often person-driven.
Formula: MRR(New)= Prospects n=15CR[n]Monthly Fee
- 2. Recurring Revenue: This stage establishes a recurring revenue stream that creates a compound impact based on churn and upsell metrics. If the impact is felt monthly (versus annually), a more rapid increase or decrease is possible as the impact compounds over the number of periods (p).
Formula:
ARR(Growth)=MRR(New) (1+CR6+CR7)p
- Lifetime Value: The later, post-sale stages of revenue generation, during which exponential growth provides a disproportionate amount of revenue. By extending the average contract length (ACL), a company earns a disproportionate amount of profit.
Formula:
LTV=MRR(New) (1+CR[6]+CR[7])ACL
In many companies, most of the quality and volume of resources are applied to the customer acquisition processes, primarily to two conversion rates (CR2 and CR4). However, a company’s success depends on a system in which profits are generated due to growth of recurring revenue over an increased customer lifetime. In many cases, this is where the least amount of quality resources are applied.
For the past several decades, most companies have used a traditional model typically referred to as the “sales and marketing funnel.” According to this funnel, the marketing function is responsible for generating a certain volume of leads at the top of the funnel, sales development is responsible for qualifying those leads into opportunities, and sales is responsible for converting those opportunities into becoming paying customers. Leads go into the top of the funnel, emerge as paying customers from the bottom of the funnel. This model does apply, but only for companies that earn most of their revenue when the customer makes that initial purchase, such as a one-time hardware purchase.
Why the funnel doesn’t work for a recurring revenue business
But there is a fundamental problem with this model: Recurring Revenue takes place outside the purview of this conventional funnel. Why? Because the funnel ends at the point when the deal converts to a paying customer…which means that the funnel does not show the recurring revenue that takes place in the months and years during which that customer uses the product they purchased, when they renew their contract, and when they expand their usage. In a recurring revenue model, 72 to 93% of the lifetime value that we get from a customer happens after the initial deal.
If you use a recurring revenue model, the funnel only leads us to the halfway point.
And further still, it often leads us to the wrong conclusion, which is the idea that “in order to grow, we need to win more deals…and to win more deals, we need to have more leads.” Many companies then decide to rely on a volume-based strategy as a result: just get more (leads) into the funnel, and more (deals) will come out.
What recurring revenue businesses need instead is a model that covers the entirety of the customer journey. This model needs to account for the actual growth loops that take place in recurring revenue, and account for them in the right place along the customer journey.
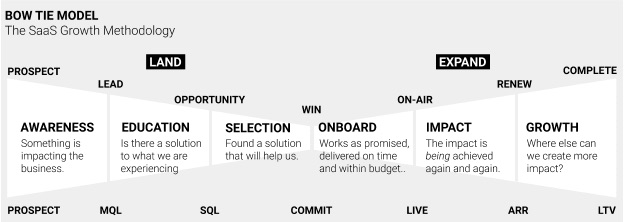
For this, companies need to apply The Recurring Revenue Bowtie. The Bowtie is already being used by hundreds of high-growth SaaS and recurring revenue companies. Instead of stopping at the halfway point, it accounts for what happens after the initial deal is made: onboarding, getting to first impact, renewal, and expansion.

Figure 1. The Recurring Revenue Bowtie. The Bowtie and associated frameworks from the Recurring Revenue Operating Model are all available open source, at www.thescienceofrevenue.com
Because of this recurring revenue model, we have to think about the customer buying process much differently than we did in the past.

Figure 2. Figure 2. Visualization of the types of sales methodologies.
Traditional Sales Methodologies
In traditional sales models, the funnel always looked the same but involved a range of different types of sales methodologies: solution selling, consultative selling, and strategic selling.
Solution Selling. The original methodology was called solution selling. A customer comes to your sales team already aware of the problem and the probable solution. The sales rep only has to assist the customer with selecting the right product. This is the shortest of the methodologies, as it involves only the first part of the funnel.
Consultative Selling. This methodology is used when a customer knows that they have a problem, but they need help understanding potential solutions. In this method, the sales rep has to educate the customer on the options as well as help them select the right product. Consultative selling typically focuses on identifying and influencing the company’s key decision maker.
Strategic Selling. The above methodologies worked well until about 2003, when the dot-com bubble burst. Cash-strapped customers suddenly weren’t interested in buying new technology. Sales teams had to get more creative, pushing innovative solutions even if a customer hadn’t identified a specific problem. One of the classic indicators of strategic selling — also known as provocative selling — is an on-site workshop for leaders of a company looking to optimize or overhaul their business. This methodology often requires executives from the seller to reach out to executives from the buyer.
The SaaS Sales Method
The SaaS Sales Method is a modern sales approach, developed to serve the unique needs of the SaaS business model. With a SaaS methodology, profit generation shifts from soon after closing the deal, to months or even years in the future, at the point when the solution provider delivers the impact that the customer was promised. In many cases, persistent use of the service and growth of the account are needed for the SaaS company to achieve profitability on that account.
The SaaS Sales Method involves all customer-facing employees (Marketing, Sales, Customer Success). It emphasizes the importance of discovering, communicating, and delivering business impact consistently across the entire customer journey. In addition to the traditional steps along the funnel — awareness, education, and selection — the SaaS Sales Method adds onboarding, use, and expansion. It looks ahead to the lifetime value of a customer, rather than only what happens before the initial contract is signed.
Marketing and sales have traditionally operated in silos, which resulted in hand-off points where qualification criteria were used. For the SaaS Sales Method to be successful, we have to transition from qualification-driven sales (usually limited to a one-time event) to impact-driven sales (happening anywhere during the relationship with the customer).

Figure 3. The difference in qualification criteria based on budget (one-time) vs. priority (anytime).
Of note here is that the SaaS Sales Method doesn’t replace all the other methodologies; instead it combines and leverages all the previous methodologies. Teams may use a provocative technique for prospecting, a consultative technique for qualification, and a solution-oriented technique for selling. That essentially is what happens today with many high velocity sales organizations.
The Seven Key Moments that Matter
There are a few specific moments in sales that require special attention. If you and your team perform well during these moments, they will work in concert to generate success. We’ve identified seven key moments that are crucial during the SaaS sales cycle.
Business results, not fit. In the SaaS Sales Method, the concept of fit is reframed as impact. For example, the sales team at a car dealership must understand that they are not just selling a car — they are selling the ability for their customers to get to work and to provide for their family. Uber realized that impact could be unbundled from the car itself. Now Uber now sells pure impact (the ability to get around) to its customers, eliminating the need to actually own or even rent a car.
Conversation, not qualification. Instead of determining whether a prospect is “qualified” for your solution, focus on the fundamental skill of conversation. Conversation is a more natural, human activity. It helps you connect with the prospect on an emotional level and uncover real, pressing pain points. Have a clear idea of whether, when, and how your solution can have an impact on the customer’s business.

Figure 4. The difference in qualification criteria based on budget (one-time) vs. priority (anytime).
Diagnosing, not pitching. Keep this in mind: “Prescription before diagnosis is malpractice.” A salesperson must first understand the customer’s pain and what they want to achieve, before recommending a solution that will benefit the customer’s business.
Trading, not negotiating. This single change in wording and emphasis can have one of the greatest effects on your cumulative sales. When two parties negotiate, typically both parties come away with having given up things that they want; both parties walk away with something they were hoping to get, but compromising on other things so that a deal could be struck. That’s not a win-win scenario. Instead of negotiating, think about what you’re doing as trading. For instance, if you’re asking for something of value from the other party, what are you going to offer to them that is of equal value. This mentality forces the seller to think from the customer’s point of view, not just their own.
Orchestrating, not onboarding. Rather than just onboarding the customer to get them to start using the product, consider this to be an opportunity to orchestrate the entire business relationship going forward. Guide how the relationship will develop, set milestones for success, and ensure the relationship is set up to provide real impact to their business.
Results, not usage. Product usage isn’t a proxy for success. You should be looking at the success of the product itself. A more impact-focused approach would be to explore whether the customer is getting the results they need from the product.
Growing, not upselling. “Land and expand” implies that the customer is like a territory that should be mapped, flanked, and conquered. Instead, expansion teams should be thinking about growing the customer relationship. It’s the impact that matters most to the customer.
Jacco J. van der Kooij, Founder Winning by Design, Palo Alto, California
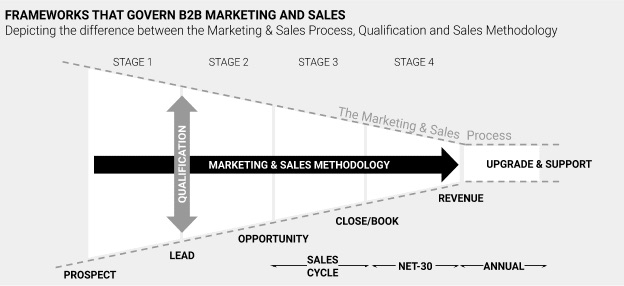
Traditional B2B marketing and sales frameworks such as the sales funnel, lead qualification and sales methodologies do not achieve the desired results in SaaS businesses.
Definition of the Frameworks
A sales methodology describes the process of how to acquire revenue, and a qualification methodology describes what you are going to measure. When you combine lead generation, lead qualification, and customer acquisition processes you get a system. In marketing and sales, this system historically has been referred to as the funnel. Recurring revenue models such as SaaS leverage a client’s success to create compound growth and need their own framework.
SaaS Sales Has Outgrown the Funnel
In 1898, Elias St. Elmo Lewis developed a model that mapped a theoretical customer journey from the moment a brand or product attracted consumer attention to the point of action or purchase. He created a four-stage process Awareness, Interest, Desire, and Action, or AIDA [Ref. 3.]. This term was popularized when enacted in a scene by Alec Baldwin in the movie Glengarry Glen Ross [Ref. 9.]. In the AIDA model, revenue and profits are realized shortly after the client signs on the line which is dotted.
Many sales and marketing organizations still use a derived version of AIDA today: Namely, the marketing and sales funnel. The lines between marketing and sales have blurred over the years, but the funnel and its shape remain the way how we describe and visualize the process. Around 2008, a new business model became popular, in which the upfront purchase and profits were exchanged in return for a recurring revenue stream.
Up to this point, software was sold using three to five-year contracts, measured in hundred thousand to millions of dollars, and often paid upfront.
The recurring counterpart of this model, which we now know as SaaS (Software as a Service), offered the exact same impact at a fraction of the price by replacing the perpetual revenue with a usage, monthly, quarterly or annual revenue. In the years that followed, a refined version of the opportunity stages became the basis of the sales funnel [Ref. 7].
Historically, there has always been a gap between the strategy and sales implementation [Ref. 4], but never more so than with a recurring revenue model. As you can see in Table 1, with the perpetual B2B model, 60% of the total revenue on a deal is secured on the win and the remaining 40%, from automatic upgrade and support renewals in future years. What is more telling is what happens in the recurring B2B model, where only 18% of the revenue is secured on the win.
Table 1. Distribution of revenue across five years of a perpetual sales model
| Perpetual | Year 1 | Year 2 | Year 3 | Year 4 | Year 5 | Total | |
| Purchase price | $120,000 | $120,000 | |||||
| Upgrade & Support | 20% | $24,000 | $24,000 | $24,000 | $24,000 | $24,000 | |
| Annual Revenue | $144,000 | $24,000 | $24,000 | $24,000 | $24,000 | $240,000 | |
| % of total revenue | 60% | 10% | 10% | 10% | 10% |
Table 2 shows that with a recurring model, 82% of the total revenue of a single deal comes from future revenues. The lion’s share of profit in this recurring B2B model has shifted beyond the original win [Ref. 10]. As a result, recurring sales have outgrown the traditional sales funnel. Businesses that are based on a recurring revenue stream require a new model. This model is referred to as the bowtie model.
Table 2. Distribution of revenue across five years of a recurring sales model
| Recurring | Year 1 | Year 2 | Year 3 | Year 4 | Year 5 | Total | |
| Annual Price | $24,000 | $24,000 | $25,200 | $26,460 | $27,783 | $29,172 | |
| Annual Expansion* | 5% | $1,200 | $1,260 | $1,323 | $1,389 | $1,459 | |
| Annual Revenue | $25,200 | $26,460 | $27,783 | $29,172 | $30,631 | $139,246 | |
| % of total revenue | 18% | 19% | 20% | 21% | 22% |
*The different models provide a very different growth model. The perpetual model is for low volume/big deals, whereas recurring models grow at an accelerated rate due to its lower price and shorter-term contract.
The Bowtie Model
The origins of the bowtie model lie in the travel industry, where it has been used since its inception in 2009 [Ref. 20.]. In the bowtie model, the knot of the tie is the point at which a ticket purchase is made. To get to this point, the traveler has narrowed down the destination, date and price options, and made a purchase.
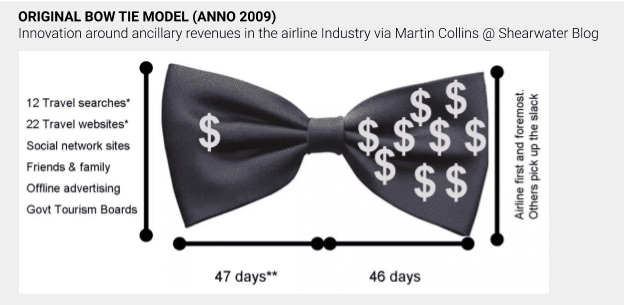
What follows is growth from ancillary revenue streams such as seat upgrades, baggage, rental car, and hotel but also credit card fees. Before 2009, there was no model for this, and thus no process to capture the ancillary revenues. Today ancillary revenues from credit card fees alone have become a billion-dollar business, and for many airlines, an important profit center [Ref. 5.].
A similar situation occurs in SaaS subscription businesses. In SaaS, the majority of the profits often occur 12 to 18 months following the original commitment [Ref. 1.]. Similarly, the traditional sales funnel does not model how to capture this future revenue.
If you apply the bowtie model to SaaS, it must cover three critical stages beyond the original commit: The installation stage aimed to achieve first impact; the impact stage where customers achieve the desired impact and the recurrence of the impact; and the activity of growing the business together with your client to expand the impact beyond its original scope.
The last two stages create a loop resulting in a compound growth engine. In comparison, a funnel was designed to achieve linear growth. To achieve compound growth, we differentiate between two different methodologies that are often confused with each other:
- A sales methodology – How to acquire the revenue
- A qualification methodology – What to measure and identify qualified opportunities
Let’s start with explaining what a sales methodology is.
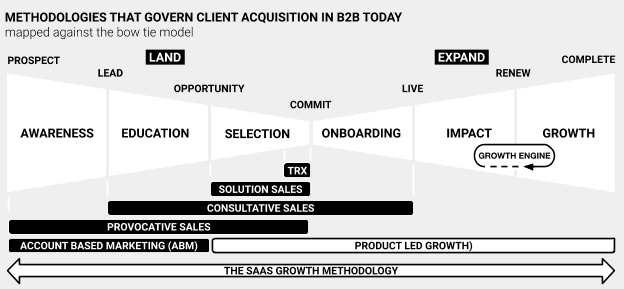
Sales Methodologies Governing B2B Sales
There are a number of B2B sales methodologies that govern B2B sales focusing on acquiring revenue. Mapping each of these methodologies against the bowtie model provides insights into how they differ.
Transactional Sales (TRX): A price/shipment-based sales methodology where the client prefers to have as little human involvement (preferably none) as possible. Think of buying something on Amazon. Price, simplicity, and speed of purchase are key decision factors.
Solution Sales [Ref. 14]: The client understands the problem very well and identified two to three options. The client is looking for a seller to answer a few pointed questions, one of which can be the decisive differences over competitors. When a company invested in a unique feature, feature selling is a must!
Consultative Sales [Ref. 15]: The client realizes they have a problem but does not understand the full impact the problem has on the business. Through a series of diagnostic questions, the seller establishes value across the organization and develops a sense of urgency to free up more budget and/or prioritize the budget.
Strategic Sales [Ref. 16]: Client does not realize they have a problem, and a seller – a true expert in this field – provokes a senior executive by reframing the problem or highlighting an immediate opportunity. The key is to get an executive buy-in early on, and to work with the client to identify the impact it can have on their business.
Account Based Marketing [Ref. 2]: When selling a commonly known solution to a commonly known problem (think of a CRM, ERP or MAS), the seller targets a number of decision-makers, influencers and advocates at hand-picked companies with personalized messages and content through marketing and advertising campaigns. It is key is to be relevant to each individual person.
It is important to realize that none of the aforementioned B2B sales methodologies actually address the compound growth engine which is critical to the growth of recurring revenue businesses. Instead, many revenue leaders maintain a maniacal focus on winning more deals, which ironically prevent them from growing the business at a fast rate.
Over recent years, there is one specific methodology that has actually leveraged the growth engine with great success and benefited from the compound impact it creates:
Product Led Growth [Ref. 12]: This is a B2C like methodology that can be used with a high-quality product and/or service experience in B2B. It encourages customers to contribute to marketing the product by using their own social networks to share and amplify the product. A basic example of this is giving a free month of service to an existing user if two of their friends sign up as well. The Product Led Growth (“PLG”) methodology applies to a business that is based on a high amount of deals per month with a low contract value. Key to this methodology is to have a high-quality product, and it further helps to have a very unique feature. Products such as Slack, Zoom, and recently Superhuman, are experiencing the benefits of this methodology. The downside is that this requires the momentum of 100,000s of users which doesn’t apply to most B2B applications and platforms.
Combining the above best practices, a new methodology can be designed for companies that sell B2B applications and platforms, at a much higher contract value, and are based on a recurring revenue business model.
SaaS Methodology: This methodology applies to B2B applications and platforms where a large percentage of the customer lifetime value is realized after the initial sale [Ref. 10]. This methodology modernizes and extends prior marketing and sales methodologies but does not replace them. It does so by adapting these methodologies to higher velocity sales cycles. The methodology includes the processes for demand generation and prospecting as well as post-sales processes such as customer success and account management. A hallmark of the SaaS methodology is to not only make a customer aware of an innovative way to solve the challenge they are experiencing, but to show the impact of the solution in a way that is coordinated and ongoing.
In recurring business, by definition, if a client churns before a profit is established, a loss is made. This makes calling on the right client extremely important. The process of calling on the right client historically is referred to as qualifying. Next, several qualification methodologies are described and how they differ compared to sales methodologies.
Qualification Methodologies That Govern B2B Sales
Think of a marketing and sales methodology as a treatment prescribed by a doctor. When you have an allergic reaction to poison oak, a doctor may prescribe you with a treatment to take two pills per day, right after a meal, for the next five days. In this example, the qualification methodology would be to establish if a) the treatment will have the desired impact, and b) if your body is able to deal with such a treatment.
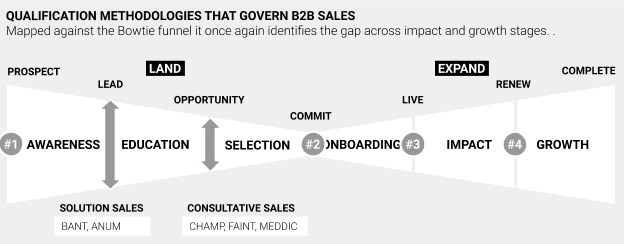
The actions taken to qualify will likely include measurement of blood pressure, but also a response to a previous treatment. Today, qualification in the marketing and sales funnel happens mostly in two particular situations: lead qualification, and opportunity qualification.
BANT is one of the most frequently heard qualifications methodologies [Ref. 6]. It was originally developed by sales teams at IBM during the 60s. They used BANT to recognize buyers for their mainframe computers versus those who only wanted to see a demo of these enormous machines. BANT is an acronym for Budget, Authority, Need, and Timeline of the decision. Historically, BANT and other qualification methodologies such as ANUM, which stands for: authority, need, urgency, and money, match up well with the solution sales methodology [Ref 14].
CHAMP and FAINT [Ref. 8] are qualification methodologies that add qualifiers around the ability to identify challenges a client experiences and make it line-up well with the consultative sales methodology [Ref 15].
MEDDIC is perhaps the qualification methodology that is found the most common in recurring revenue businesses is MEDDIC [Ref. 11]. And for good reason, created by Dick Dunkel and Jack Napoli during the 90s, MEDDIC differs in that it adds a qualifier in identifying if an impact can be made on a client’s business.
There is no qualification method that is better or worse; what determines the success of any given qualification methodology is how it is applied. For example, using BANT to qualify a CEO in a provocative first-call is doomed for failure. In a similar vein, peppering a client with a series of questions while they are ready to buy is not going to yield the desired result either. What is missing is a qualification methodology that matches up with the subscription business. In particular:
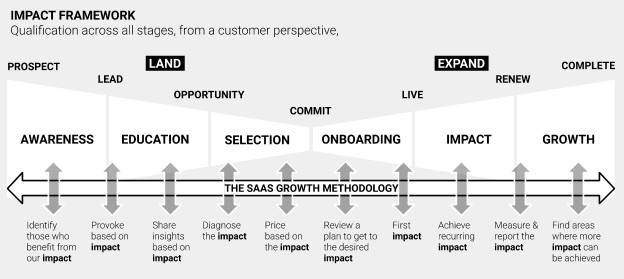
#1. Does the client have an opportunity that can positively be impacted by the seller?
#2. Can the seller help the client achieve the impact in the timeframe the client needs it?
#3. With reasonable certainty, will the impact for the client result in a profit for the seller?
#4. What’s the growth potential beyond the original impact?
It’s clear to see what ties these four questions together: impact. Impact is the standardized qualifier that matches up with the SaaS methodology. Where recurring revenue is the result of recurring impact for the client.
The Impact Framework
There are two ways that impact is perceived: 1) Rational Impact, which is measurable using facts and figures, and 2) Emotional Impact, which is mostly about feelings and experiences. Research shows that people tend to make an emotional decision then validate that decision with facts and figures [Ref. 18].
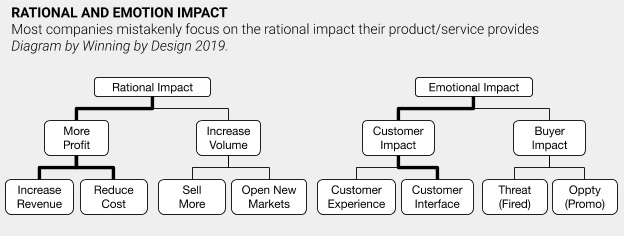
Emotional impact benefits an individual first, whereas rational impact benefits a corporation first. For example, if a decision results in one-million-dollar savings per year for a company, it is unlikely that the savings are going to find its way into the pocket of the decision-maker.
However, an automated dashboard will directly reduce headaches for the person manually creating reports every weekend. This means that sellers must not only identify their ideal customer profile, but also the type of impact that is most important to each person they are working with, and customer success must ensure this impact is achieved over time.
Organizations have to extrapolate the impact across all parts of the business using an Impact Framework that acts as a qualification framework across all stages.
Findings
Finding 1. The traditional B2B marketing and sales funnel and its qualification methodologies were built for a perpetual business and do not address the needs of a recurring business model (SaaS).
Finding 2. In SaaS, growth comes from recurring revenue. Recurring revenue is the result of recurring impact the customer experiences and is not the same as recurring usage as commonly measured by sellers.
Finding 3. To help customers accomplish a recurring impact, additional stages must be added to the process. Recommended stages to add are: Achieve Recurring Impact and Growth of Impact. This is depicted with a bowtie.
Finding 4. All customer-facing roles must work of the same uniform methodology across all roles and departments, not one that is dictated by one department or is based on the use of a specific software tool.
Finding 5. Qualification is not something that should happen once but throughout the entire process. The qualification methodology must match the sales methodology. For businesses dependent on recurring revenue, an impact-based framework is recommended.
Suggested Actions
Here are a few suggested steps:
Action 1. Bring together a team of representatives from all customer-facing roles to help identify the Rational and Emotional Impacts
Action 2. For each department, create a plan to qualify based on the impact and what action to take.
Action 3. Create a hand-off process between departments based on Impact
Action 4. Codify the agreed actions for each department into your tool stack.
Action 5. Measure and report the number of new leads generated by existing clients.
References
Ref. 1. 2018 Expansion SaaS Benchmark (slide 30) – By K. Poyar and S. Fanning of Openview Advisors
Ref. 2. Account Based Marketing by Wikipedia
Ref. 3. AIDA Definition by Wikipedia
Ref. 4. Aligning Strategy and Sales: The Choices, Systems and Behaviors that Drive Effective Selling by Frank V. Cespedes via Amazon
Ref. 5. Airlines Make More Money Selling Miles Than Seats, by J. Bachman, June 2017, via Bloomberg
Ref. 6. BANT Opportunity Identification Criteria by IBM
Ref. 7. What is a Sales Funnel? (And How is it Changing?) via The 360 Blog, salesforce.com
Ref. 8. FAINT – The New Definition of a Qualified Prospect by Mike Schultzs, via RAIN Group blog
Ref. 9. Glengarry Glen Ross, An examination of the machinations behind the scenes at a real estate office. Released Oct. 2, 1992 by Newline Cinema
Ref. 10. How Adobe, GoPro, Microsoft, and Gillette Saved Their Businesses Through Subscription Revenue by PriceIntelligently via blogpost
Ref. 11. MEDDIC Definition by SalesMeddic via their website www.salesmeddic.com
Ref. 12. Leading with your product is the most effective GoToMarket Strategy by M. Alon via Slideshare
Ref. 13. Seven Sales Qualification Methodologies by Jeremy Donovan via Slideshare
Ref. 14. Solution Selling Definition and Research by Nadia Landman via blogpost on web-site
Ref. 15. SPIN Selling by Neil Rackham via Amazon
Ref. 16. The Strategic Sales: Taking Control of the Customer Conversation by Matthew Dixon and Brent Adamson via Amazon
Ref. 17. The Power of Habit: Why We Do What We Do In Life and Business by Charles Duhigg via Amazon
Ref. 18. The Power of Persuasion: How We’re Bought and Sold by R. Levine published in 2003 via Amazon
Ref. 19. The SaaS Sales Method: Sales as a Science, by Jacco J. van der Kooij, via Amazon
Ref. 20. Updated Bow Tie and Lead Time Numbers by Martin Collings via Shearwater Blog May 14, 2009
Ref. 21. Why CHAMP is the new BANT. – By InsightSquared, via Blogpost.