MEDDIC has long been one of the most effective sales methodologies used in enterprise sales. In the years since MEDDIC was originally developed, the focus of sales has shifted to the idea that recurring revenue happens after you close a deal. And while MEDDIC works quite well for a seller-centric sales motion that primarily focuses on closing deals, it provides less guidance for what happens after the deal is closed (Figure 1). Recent updates with derivatives such as ‘MEDDPIC’ (Paperwork) and ‘MEDDICC’ (Competition) add an even greater focus on closing. This extreme focus on closing causes challenges when applied to a recurring revenue business, such as SaaS.
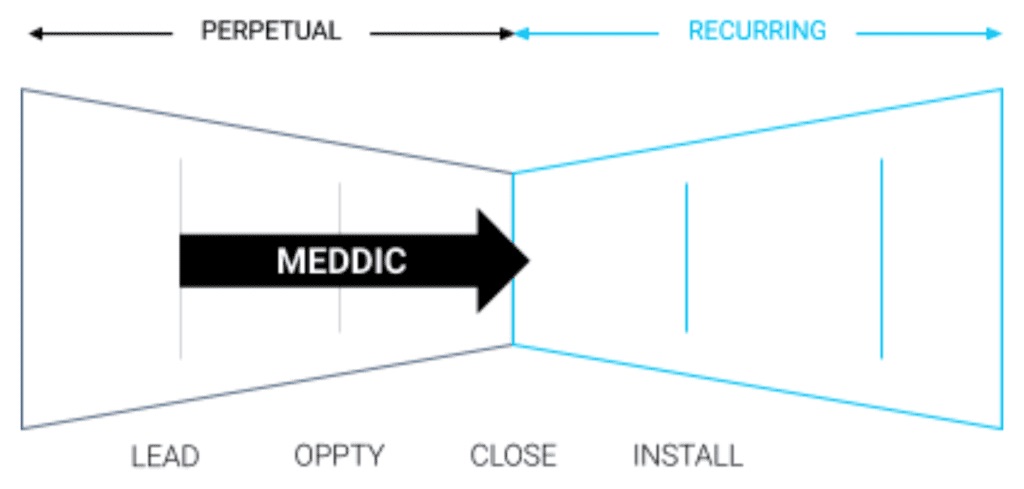
Figure 1. The application of MEDDIC in Enterprise Sales
In SaaS, the revenue is not paid up front, but spread over months or years. It is quite common for a profit to be realized 9 to 18 months (Ref. 2.) after the client makes a commitment. Any time after committing, if the client does not experience the impact they are looking for, they can and will cancel. So to earn a profit, you need a recurring revenue stream — and to earn that, you need to provide the recurring impact a client wants. The focus on “closing a deal” not only increases the churn — it increases the losses.
This demonstrates that we need to think differently here, that we need to treat a SaaS deal different from a perpetual one. Here are a few considerations:
- Recurring revenue is the result of recurring impact: Gaining commitment from the right clients means that you first must understand the impact that clients are seeking.
- Priority, not budget: SaaS clients buy dozens of SaaS products, and their decision is not based on “Do we have a budget?” but rather, “Is this a priority?” So you must understand if the impact you can deliver matches up to your client’s priorities.
- Company wide, not just the sales team: In SaaS, all departments (whether they realize this or not) are connected through the concept of Impact: Marketing raises awareness of the impact you can provide, the Sales team qualifies prospects based on the ability to deliver impact, and Customer Success is responsible for helping customers realize the impact that you have promised.
- The risk is no longer on just the buyer: With perpetual sales such as hardware, the risk mainly lies with the buyer; no seller will be fired for selling too much. However in SaaS, similar to a rental car company leasing out a car, the seller also faces certain risks, because the buyer will cancel if they do not realize the recurring impact they are expecting.
To fill this gap, consider SPICED — a customer-centric diagnostic framework that focuses on delivering the customer’s desired impact, on a recurring basis. The methodology is based on the fundamental principle that recurring revenue comes from recurring impact (Figure 2). By using SPICED and MEDDIC in combination, a SaaS revenue team can apply these methods together to successfully drive recurring revenue.
Figure 2. The application of a methodology to apply to Recurring Revenue
Many SaaS companies using methodologies designed for perpetual licenses (Ref. 3, 4, 5, 6) are starting to see their conversion rates decline, and this is because their sales teams are not well equipped with a sales process that matches with the actual journey that a SaaS customer takes. By focusing their process only on closing the deal, those companies are preventing their Go To Market teams from providing the true impact to customers of which they are capable.
We have created a methodology specific to a recurring revenue business, in order to address the full customer journey. This methodology is called SPICED. You can see in Figure 3 that MEDD(P)ICC focuses on the criteria that the seller needs to close the deal, while SPICED is a customer centric methodology that focuses on helping the customer realize the impact they are seeking.
How to Make MEDDIC Work in a SaaS Model
MEDDIC can be applied quite effectively in a Software as a Service (SaaS) sales model, by combining it with the SPICED diagnostic framework. Consider the following tips to implement the MEDDIC framework in your SaaS sales process:
Qualification vs. Sales Methodologies
A sales process is a series of actions you must take in the correct sequence to achieve results. To give a customer an outstanding experience, place your actions into stages. Each stage includes a series of actions you will perform in the correct order. A proper sales methodology typically includes the following approximate stages:
- Identify
- Diagnose
- Assist
- Navigate
- Recommend
- Trade
- Commit
Typical lead qualification methodologies are based on the idea that qualification only needs to occur as a one-time event. However, the MEDDIC framework is a deal qualification methodology that operates on the idea that qualification should be performed consistently across every stage and action of the sales process.
Sales methodologies are meant to enable the buying experience that we create for customers. But if one methodology focuses on lead qualification, one focuses on deal qualification, and another focuses on deal closing — then this means that a revenue team would need to combine several methodologies at once, which can be quite challenging. It also ends up with different groups within the the same revenue team speaking different languages: for instance, the SDRs qualify using BANT, the AEs use the MEDDIC methodology, and Marketing uses the AIDA framework.
SPICED vs. MEDDIC
MEDDIC is historically based on the idea that growth comes from closing more new logos, which is of course true and cannot be ignored. However, this approach considers anything that happens after the deal is closed to be a much less important.
An alternative first principle that must be applied for a SaaS business is that recurring revenue leads to recurring impact. This means that helping the customer achieve their desired impact motivates them to continue buying more. If you continuously provide value to customers, they will keep buying from you. Because this method is impact-centric, it is automatically customer-centric. The more impact a customer receives, the more they continue to buy over time, and the more revenue is generated as a result.
SPICED is a diagnostic framework that allows for a uniform customer-centric approach, facilitating handoffs, and providing a consistent, high-quality experience for the customer. SPICED can help any AE, SDR, or CSM provide more impact to their customers by applying the diagnostic framework, which includes the following:
- Situation: Background facts or circumstances relevant to the customer’s world. These describe objective factors that determine whether the customer falls within your ideal customer profile and what is happening in their world. Factors such as size of company, number of employees, software they use, hiring needs, security needs, or revenue goals.
- Pain: The problems the customer has purchased your product or solution to help solve. This could include the need to conduct training or recruit, support a global team, pass a security audit, or stop errors to happen in a process.
- Impact: The results produced by solving pain. These are the outcomes the customer is trying to achieve by purchasing your solution. Impact can be both emotional (for individuals) and rational (for companies).
- Critical Event: Any particular deadline by which to the customer must achieve the desired impact or suffer negative consequences. Critical Events drive the customer’s timeline for a purchase.
- Decision Criteria: The people involved in the decision, the process they will follow to reach that decision, and the criteria they will use to evaluate the right solution.
The key difference between SPICED and MEDDIC is each framework’s focus and origins. MEDDIC originates from perpetual software sales and focuses heavily on the decision stage of the sales process. SPICED is based on recurring revenue, so it focuses on achieving continual recurring impact.
And yes, SPICED and MEDDIC can operate in the same world and work together. Let’s examine MEDDIC to see how this can occur…
MEDDIC (Ref. 7) consists of the following factors:
- Metrics
- Economic buyer
- Decision criteria
- Decision process
- Identifying pain
- Champion
MEDDIC is based on the concept that if you take the right actions, the desired results will automatically follow. It requires inspecting the actions of sales teams to ensure they take the right steps, rather than simply expecting them to achieve results. MEDDIC operates in the following ways:
- Functions as a common language
- Allows you to achieve adoption through engagement
- Manages activity instead of results
- Examines the deal primarily from the seller’s point of view rather than the customer’s point of view
MEDDIC focuses primarily on closing the deal; while winning the deal is an element of growth, it cannot increase growth on its own. Rather, growth increases when you sell based on impact. This means that SaaS revenue leaders need to measure impact-based metrics; the savvy SaaS revenue leader knows that it’s crucial to close the right deals and gain the customers who will stay with you long-term, so you can continue impacting them positively over time.
Application of SPICED for MEDDIC Alumni
If you are a MEDDIC alumni, applying the SPICED framework is easier than you might think. There are two key areas that must be supplemented: Impact and Decision Criteria.
How to sell on Impact
To make MEDDIC compliant with a recurring revenue business, you have to understand that MEDDIC looks at metrics with a focus on growing revenue and reducing costs. It highlights the importance of an economic, or rational, impact that a solution provides to a customer.
A rational impact is quantitative and measurable. However, experts have also discovered the importance of emotional impact. Emotional impact is qualitative, based on how a product or service makes customers feel.
MEDDIC directs sellers to focus only on rational impact, while SPICED looks at both rational and emotional impact. You can apply the emotional impact to MEDDIC, as long as you identify it. This guideline typically helps: a rational impact is typically the same or similar across all people involved in a decision, but an emotional impact varies by person.
QUOTE: A rational impact is typically the same or similar across all people involved in a decision, but an emotional impact varies by person.
In the MEDDIC framework, you can identify the emotional impact by identifying pain points. Then, when you move to the decision process, you can sell the emotional impact to the champion, and then provide them with the rational impact to take back to their boss or company.
Influencing the Decision Criteria
The decision criteria in the MEDDIC framework are based on priority. You must determine what the customer’s priority is so they can compare factors and rationalize their decision. This way, you can show the customer how your product or service surpasses what competitors can offer. Apply the MEDDIC framework by translating the decision criteria into impact in the following ways:
- De-prioritize: Clarify with the customer that the price has a relatively small negative impact on their budget, relative to the increase in revenue or productivity that they will see as a result. This will help them understand that price is actually the least important factor.
- Prioritize: Introduce a new element, such as adding a new criterion or pointing out the ability to unlock a new revenue stream.
- Re-prioritize: Educate the buyer by sharing current customer success stories or introducing them to a current customer.
Applying SPICED to Customer Success
The SPICED framework can be used across all stages of the sales process. For instance, during the handoff of an account from Sales to Customer Success, a strong focus (see ‘TRANSFER CRITICAL ACCOUNT INFO’ below) must be placed on reestablishing the impact that the customer is looking for (Figure 4).
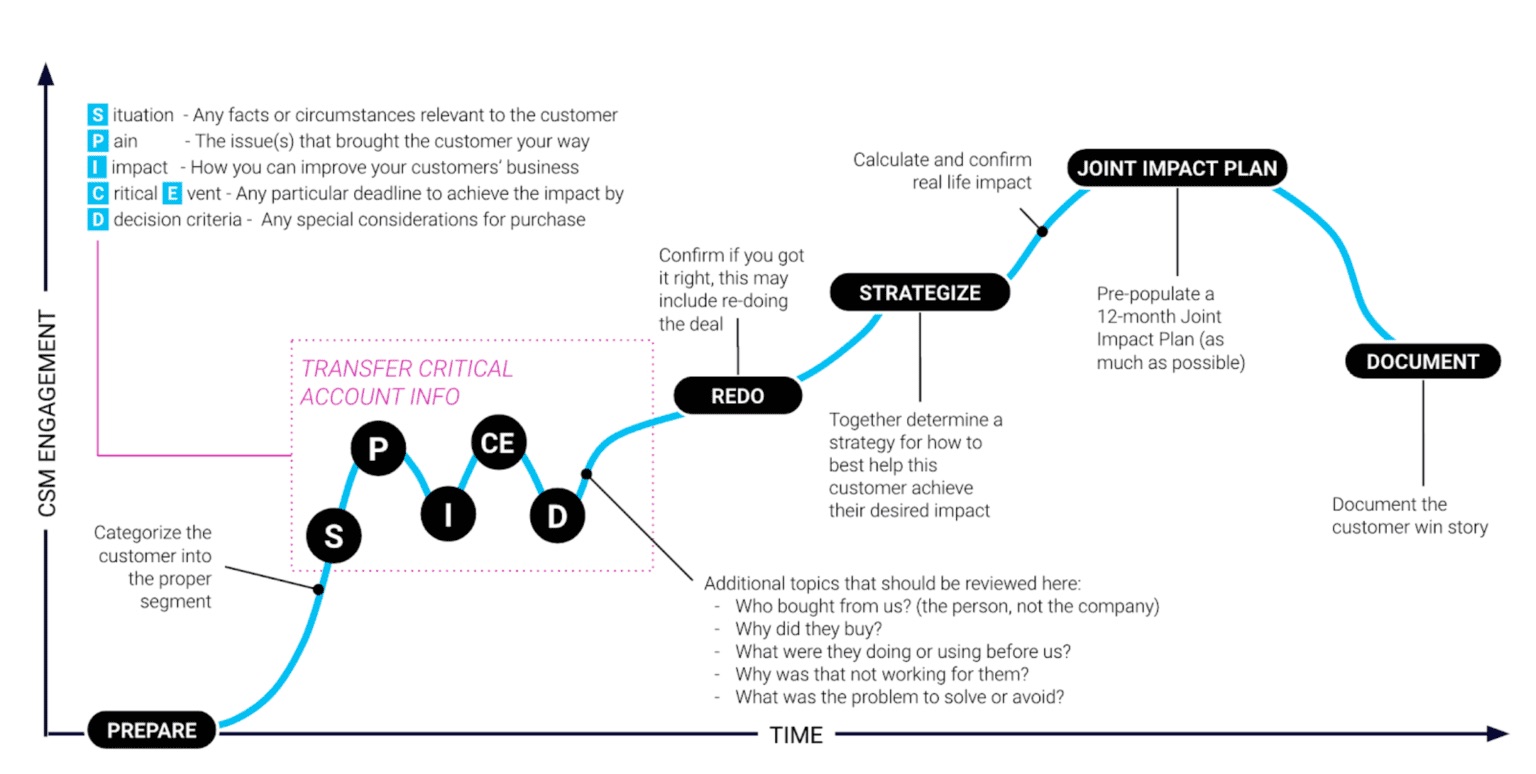
Figure 4. The use of SPICED in the hand-off between Sales and Customer Success
References
Ref. 1. 2018 Expansion SaaS Benchmark (slide 30) – By K. Poyar and S. Fanning of Openview Advisors
Ref. 2. The SaaS Sales Method: Sales as a Science, by Jacco J. van der Kooij, via Amazon
Ref. 3. Seven Sales Qualification Methodologies by Jeremy Donovan via Slideshare
Ref. 4. Solution Selling Definition and Research by Nadia Landman via blogpost on web-site
Ref. 5. SPIN Selling by Neil Rackham via Amazon
Ref. 6. The Challenger Sales: Taking Control of the Customer Conversation by Matthew Dixon and Brent Adamson via Amazon
Ref. 7. MEDDIC Definition by SalesMeddic
Every organization should determine the right compensation plan for each individual sales role upfront using a proven target-setting model and a multitude of other factors. Companies should consider how to structure base and variable pay and then set forth the responsibilities of the role and the terms of compensation clearly in a sales incentive plan.
Compensation in Sales Positions
The first step in providing fair compensation to each customer-facing role in your SaaS sales organization is the analysis of the following positions, duties, and experience required by each:
- Sales Development Rep (SDR): Prospecting. Positions may range from a first SDR job (Junior) who is focused on inbound sales to a Senior SDR with one to four years of experience who calls on key accounts (Account Development Rep).
- Account Executive (AE): Sales Acquisition, also known as a Sales Manager (SM). Positions may range from a first AE job (Junior) to an AE with three to five years of experience (AE), or four to eight years of experience (Senior).
- Customer Success Manager (CSM): Focused primarily on onboarding and enabling the client to use the product to create recurring value. Often with one to three years of experience.
- Account Manager: Focused on the company’s key accounts or driving new/more revenue from existing accounts. Often a former AE with three to five years of experience.
Step 1: Basic Guidelines
As a general rule, there are some basic, practical guidelines that you should follow as you plan and negotiate compensation with your sales organization team members:
- Keep it simple. Your compensation plan should fit on a single page of paper.
- Show causality. Make compensation directly related to the desired effect you wish for the team member to achieve.
- Think short-term. Keep the time between the activity and the compensation less than 60 days.
- Make it fair for everyone. All compensation must be fair and equal for everyone.
- Make it easy. Compensation should be easy to measure and easy to administer.
Step 2: Establish Levels of Experience
Begin by establishing three levels of roles within your organization: 1) Entry Level, 2) Baseline, and 3) Experienced/Top Performer. See Table 8.1 for descriptions of important sales roles and their accompanying levels of experience. There is an organizational need for three layers of experience in order to create a difference between an entry level position on one end of the spectrum and experienced on the other. Employees want to see progress early on in their careers, and these micro promotions answer that request and allow you both to make small adjustments accordingly.
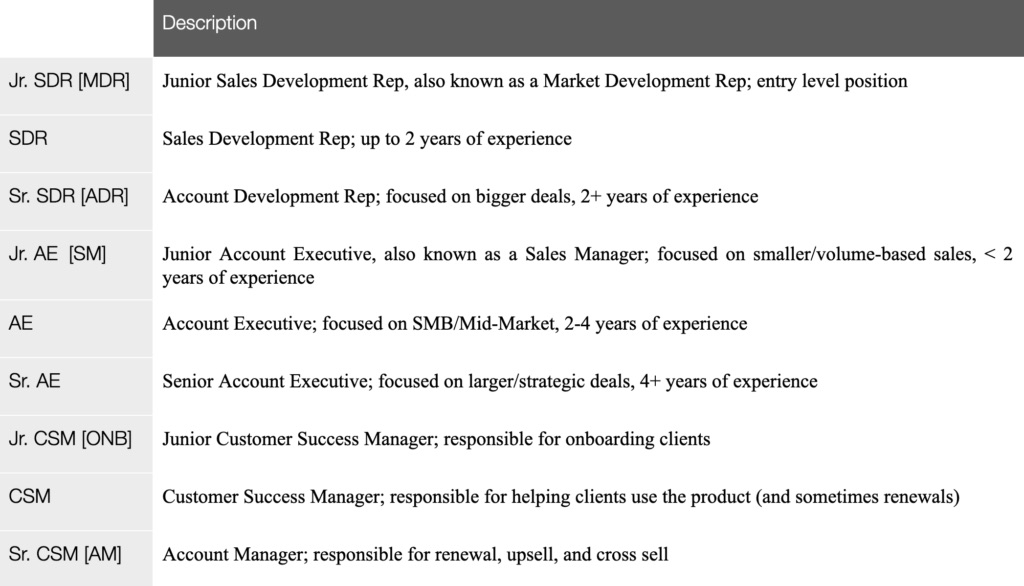
Table A. Overview of sales titles and job descriptions
Step 3: Start with On-Target Earnings
First, start with the On Target Earnings, or OTE, when determining compensation structure. OTE is the amount a person could be paid annually, and it has two elements: 1) a base salary, and 2) a sales incentive, also known as “variable” pay, which will be determined by employee performance. See Table 8.2 for a sample compensation table broken down by base salary, variable, and OTE.
Companies should refrain from calling any sales incentives a “bonus.” A bonus is not guaranteed and usually on-the-spot, whereas an incentive plan is forward-looking with payment tied to the achievement of specific objectives that have been predetermined, communicated to the employee, and noted in the incentive plan.
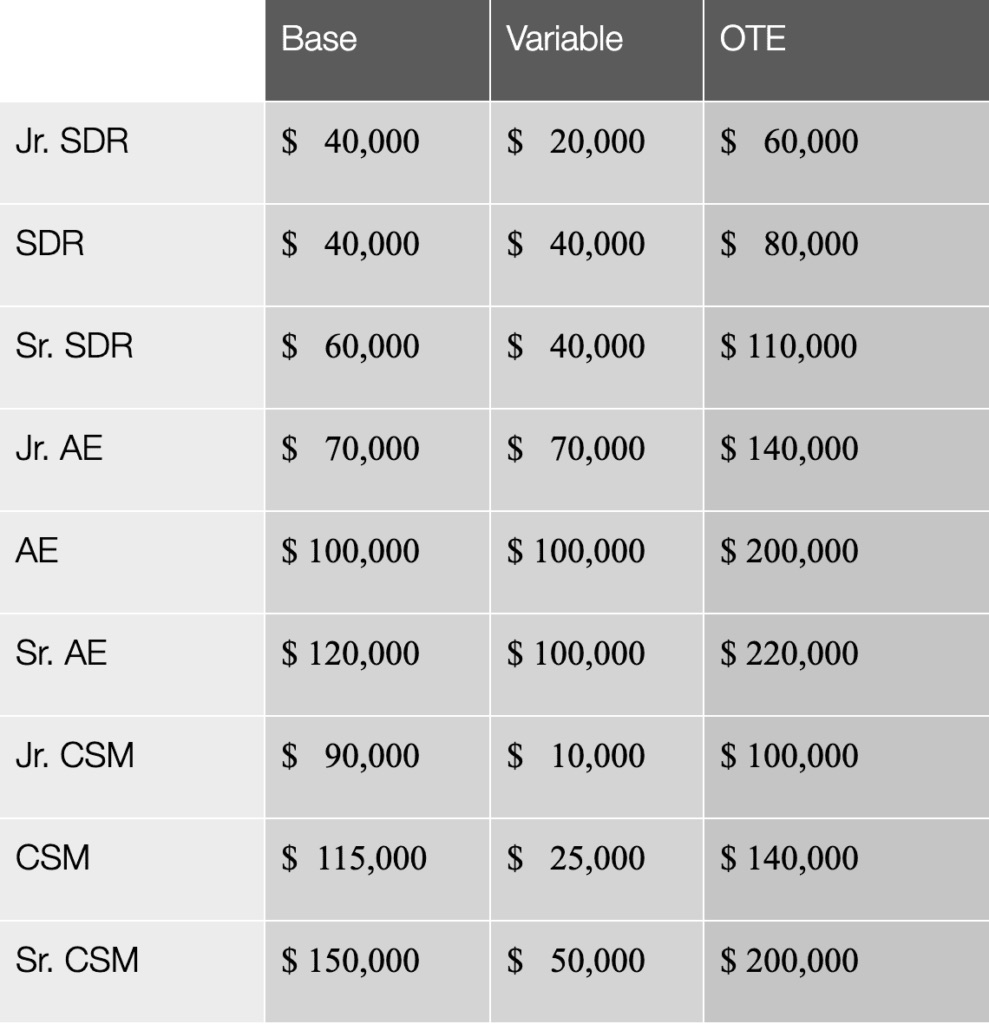
Table B. Overview of compensation in the Bay Area
Step 4: Determine Base vs. Variable
The goal behind the variable is to develop a performance-driven culture in which your sales team is financially accountable for its results. The ratio between the two types of pay is also referred to as “leverage.” A plan with a high variable alongside a low base salary is referred to as highly leveraged compensation plan.
A highly leveraged plan will mean that you only pay for results, however, this can create a lot of issues. For example, senior salespeople may not be interested in these positions as the banking system penalizes them when they apply for a mortgage, car loan, or any other request for credit. Highly leveraged plans are seen most frequently in transactional sales, where the volume is extremely high and prices are low. On the other hand, if the compensation plan has little leverage, your salespeople may be less motivated to deliver against set goals. See Table 8.3 for commonly used leverages and when they are used.
OTE can fluctuate per region, so it is highly recommended that you consult with a local recruiting firm to help determine your compensation structure before making an offer. See Table 8.4 for examples of OTE based on geographic region. Table 8.5 provides an overview of compensation packages for different sales roles in the Bay Area.
Several other variables will impact your company’s compensation plan as well, including your market, brand name, product, sales cycle, contract value, and go-to-market model. Table 8.6 breaks down each of these variables and how you should incorporate them into your compensation strategy.
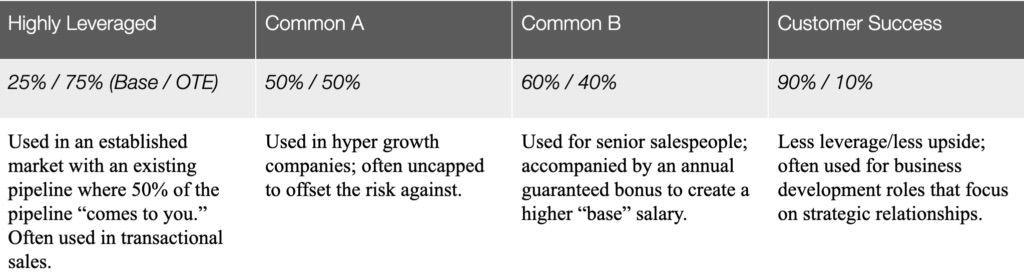
Table C. Overview of commonly used leverages
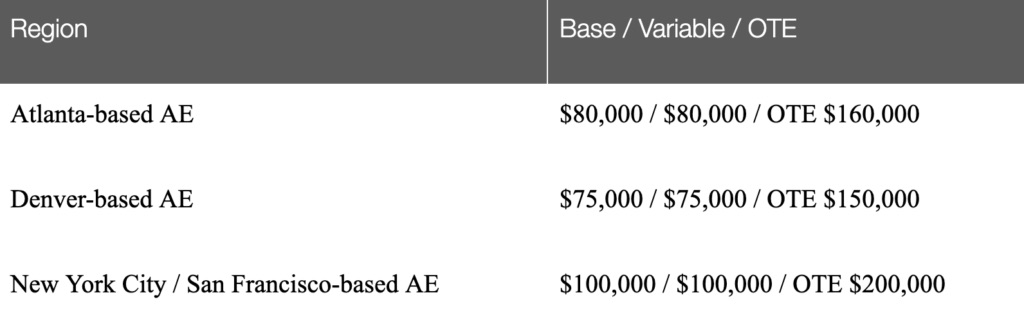
Table D. AE salaries by region as of mid-2017
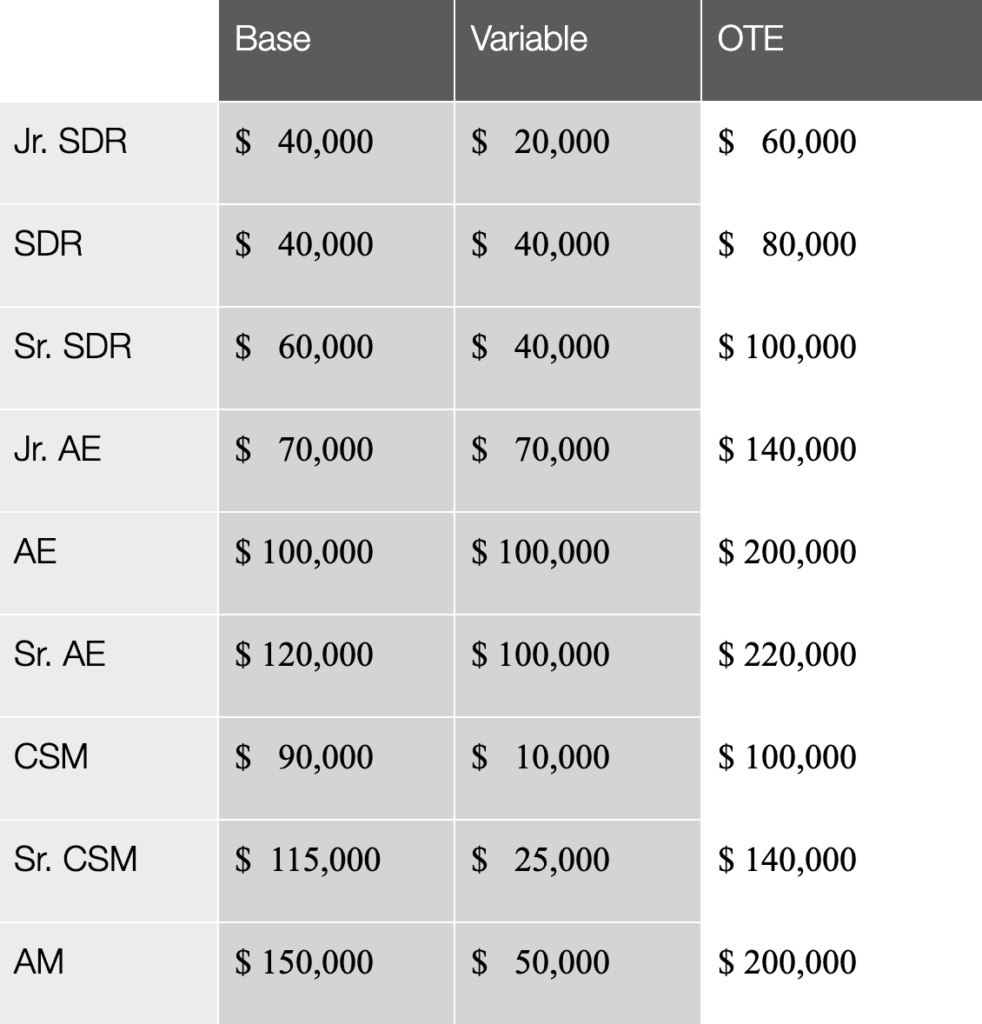
Table E. Overview of compensation packages in the Bay Area
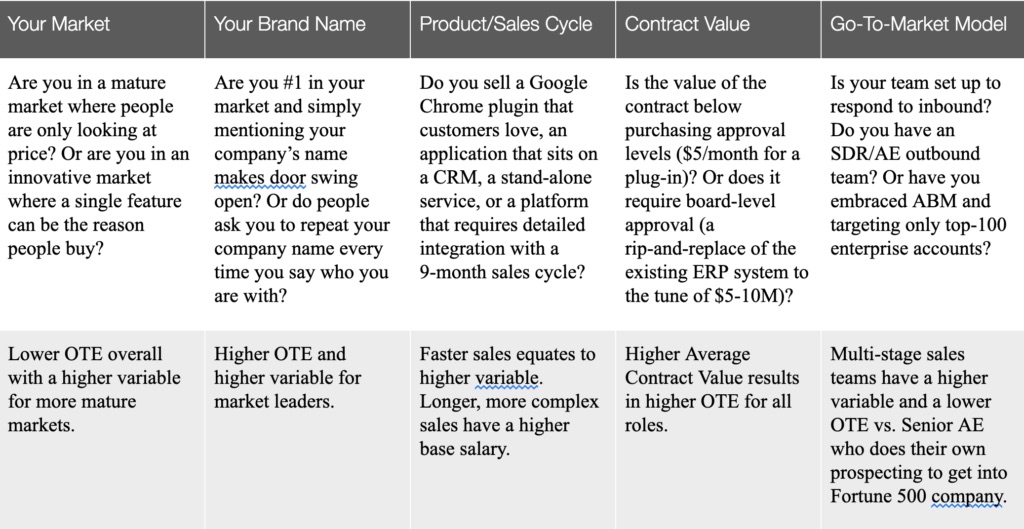
Table F. Variables impacting compensation plans
Step 5: Target Setting
There are three models of target setting that can help you determine appropriate compensation plans, each with its own pros and cons. In this instance, consider a platform product with an Average Contract Value (ACV) of $25k:
Top-Down Target Setting: Start with the amount of revenue you wish to generate (for example, $4M in ARR). Divide this by the number of salespeople you have or wish to have (for example, 4) so you can determine how much revenue that equals per salesperson. In this case, $1M ARR per salesperson. You then divide that number by the ACV per deal ($25k), which is equivalent to 40 deals won per year (or slightly more than 3 deals per month). The problem with this older B2B approach is its lack of predictability. If something goes wrong, it will be difficult to measure where and when it occurred.
Bottom-Up Target Setting: Use 80% of your best month to date as your guideline. For example, the founder over the past year was able to close $800k in business at an ACV of $25k. When hiring a salesperson, therefore, the target will be set for $640k. To hit the same $4M target, you will need ~6 sales people. The problem with this model is that founder-based sales are not scalable, and it does not take into account support or dependencies. For instance, what if you need 4 SDRs to achieve this target but 2 CSMs to bring on the client? Your company would be operating at a loss. This is a common situation in today’s sales organization as the cost of acquiring a client has increased dramatically.
Business-Case Target Setting (Recommended): In this example, a sales acquisition team that sells a CRM platform uses one SDR ($80k), one Junior AE ($160k), and one-half a CSM ($120k divided by two) to prospect, win, and onboard 20 deals per month at $25k each. This means that it costs a total of $300k. Therefore, to make a profit, this team needs to bring in at least $300k, though it is generally recommended to bring in 2x that number, so the target should be $600k. It takes three months to ramp the team, and Year 1 and Year 2 are as follows:
-
- Year 1: $600k / $25k = 24 deals (take into account a 3-month ramp)
- Year 2: $900k / $30k = 30 deals
You will also want to consider the significant impact of Lifetime Value. For example, in the FedTech space, SaaS contracts can be established with three years of commitment. This allows for a richer compensation plan compared to a company with a nine-month client LTV (AdTech, for instance). When selling new products for which LTV has not yet been established, companies should not spend more than 40% of Year 1 revenues on the aggregate cost of OTE for SDR, AE, and CSM roles. For LTVs of 2+ years, companies should not spend more than 60% of Year 1 revenues.
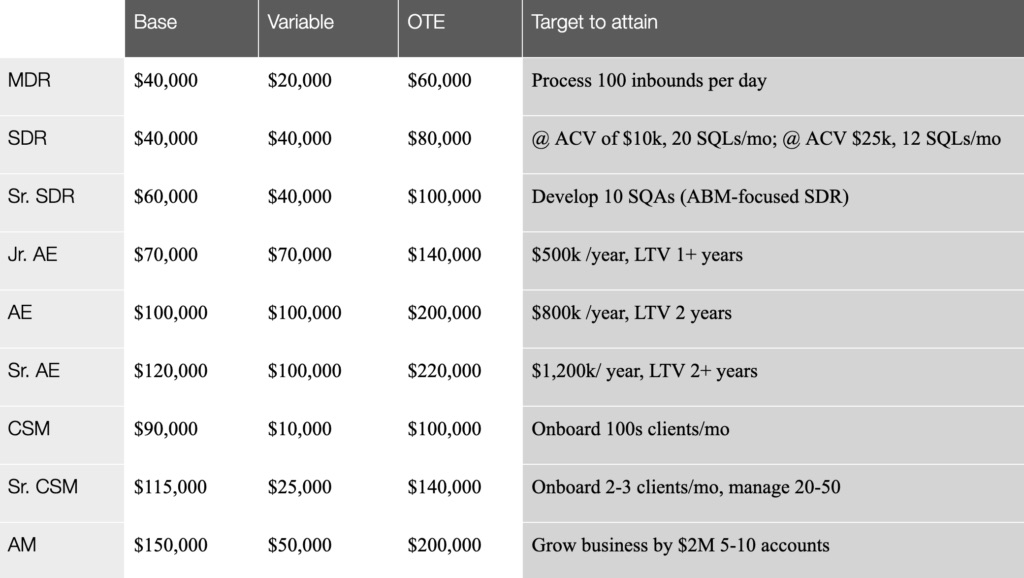
Table G. An overview of targets by role
Step 6: Account Executive Compensation
To apply each of these compensation models when hiring a AE, consider the following assumptions:
$80,000 in variable compensation needs to bring in $900,000 across ~30 deals with an ACV of $30,000.
Junior AE Assumptions:
|
Linear Model: $900,000 in 30 deals vs. $80,000 in compensation = 8.8% of every sale every month. This is good for business at the speed of 2-3 deals per month using a two-stage (SDR/AE) sales organization.
Accelerated Model: This model will drive behavior to close more deals towards the end of the season with results as follows:
- 6.4% on first $500,000 ($32,000 in commission)
- 12% on $500,000 – 900,000 ($48,000 in commission)
- 15% over $900,000 (upside)
- Remember that this model also requires matching of the commission season to the buying behavior of your customer. For example, schools/districts buy from March to July, federal government from August to October, enterprise clients from November to December, and retail from March to July.
Business Model: Depending on the results that your company seeks, these sample compensation structures are effective in the following areas:
- Size of Deal – Very effective in driving a team to sell more items to increase the price: 5% on deals less than $20,000k, 10% on deals greater than $20,000, and 15% on deals over $30,000
- Market – Very effective to open up new markets: 7% to schools in California and 10% to schools in Colorado
- Product – Very effective to drive sales of new products: 5% on standard platform, 8% on add-on services, and 15% on new platform services
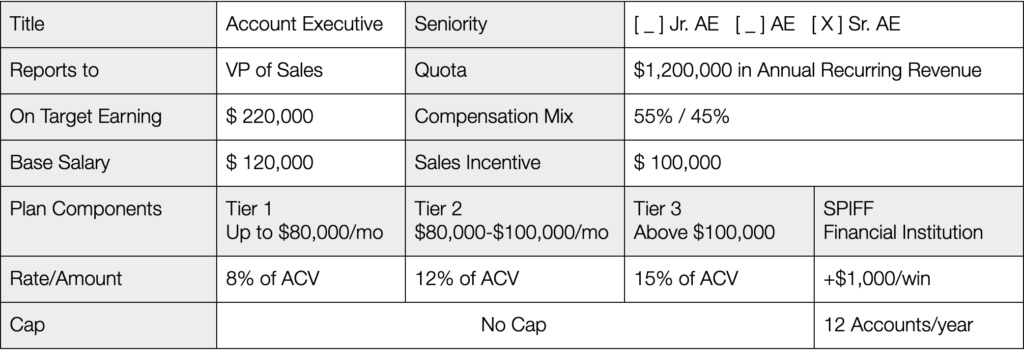
Table H. Example compensation plan for an AE
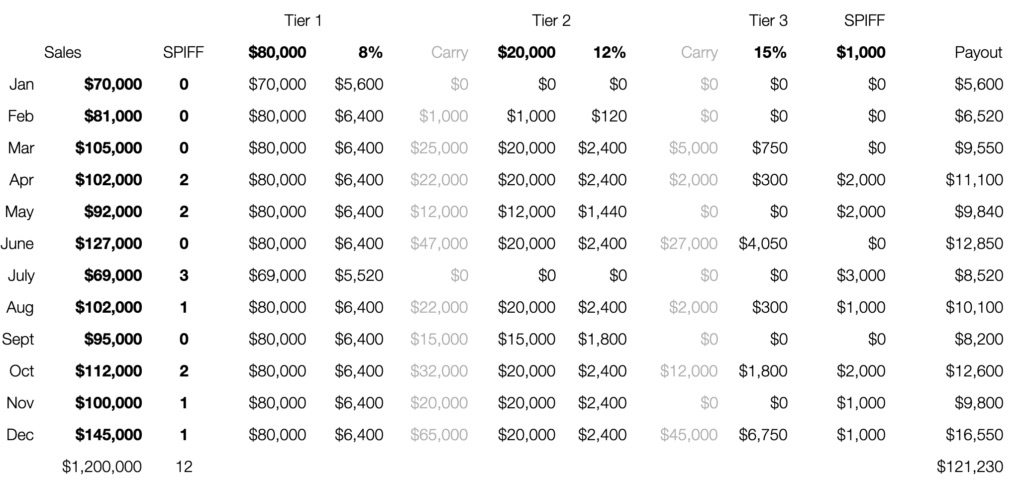
Table I. Example payout of AE using Accelerated Model and Business Model
Step 7: Compensation During Onboarding/Training
For professionals who already earn $10,000 a month in commission, it might be difficult to digest the idea of foregoing that type of money for three months when they first start working at your company and require training or onboarding. As such, it is normal for these candidates to ask that you pay this amount during the training or onboarding period. To facilitate this process, you will typically use what is known as a “draw.”
Using the example above, consider a salesperson doing $80,000 of business per month. Divided by 12 months, that equals $6,667/month. Compensation options might include the following types of draws:
Draw: Commission paid upfront against the promise of performance. Think of this as a loan without interest.
Non-Recoverable Draw: You pay $6.67k per month. If they close $10,000 worth of commission, you pay $3,333 extra. See Table 8.11 for ideas on how to make new hires “earn” the non-recoverable draw.
Recoverable Draw: You pay $6,667 per month upfront. If they only close $5,000 worth of commission, the amount of $1,667 rolls over to the next month. See Table 8.10 for more examples of recoverable versus non-recoverable draws.
Clawback: In the above example, the salesperson would have to pay back the company $1,667. Clawbacks can be used against draws but also against deals on which commission was paid if the client churned following less than three months of use. (This is often the result of selling to the wrong customer.) It is not common to claw back commission if the client churns after more than 3 months of use. (By this point, it is deemed the responsibility of the CSM team.)
Bookings vs. Cash Collections: This is a touchy subject as business in most rapid growth companies is risky. A booked client does not guarantee cash collection. Consider the following baseline ideas when deciding whether to structure compensation against bookings or cash collection:
- Compensation against bookings accelerates deals and is best used during growth. Compensation on cash collections improves the quality of deals and is commonly used during maturity.
- Early stage companies do not want to hand out money, but compensating on cash payments will not make this easier. In particular, it may result in the following downsides:
- Delayed incentives result in lack of causality
- Difficulty motivating a team on cash goals ~45 days after the deal closed
- It may signal to top talent to ignore your company as something must be wrong (high churn rates, etc.)
- There are easier ways to ensure that you only pay against companies/deals that paid:
- Claw back the next month any deals that fell through the previous month.
- Adjust quota to accommodate for premature churn.
Onboarding/Training: For companies with a sales cycle up to 90 days, 90 days is the most common onboarding time. If you sell a complex security solution and you have no prior experience, however, onboarding can easily take six to nine months. On the other end, if you are selling a Google plug-in, you may only need a few days to onboard.
As an example of a draw, consider a linear model for a compensation plan of 10% of sales based on a $900,000 revenue target with a 90-day ramp versus a variable compensation of $90,000/year or $6,667 per month.
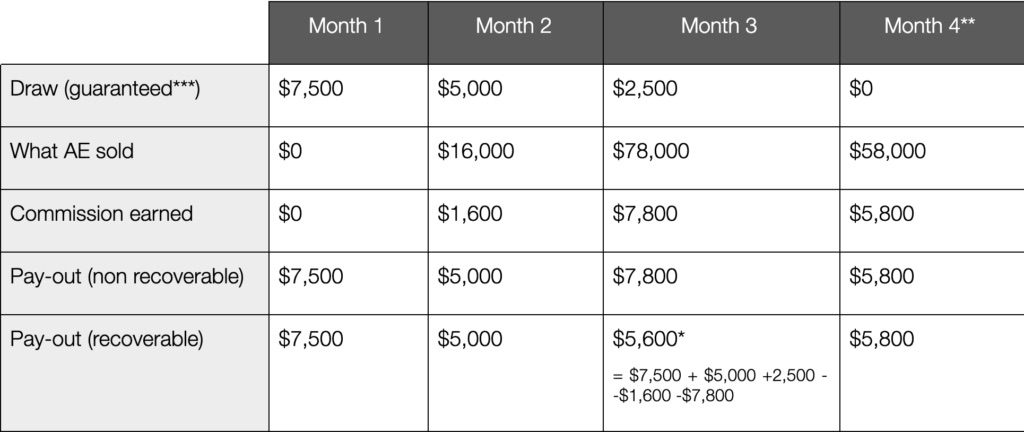
Table J. Impact of recoverable vs. non-recoverable draw
*If it does not exceed the guaranteed draw ($2,500), the draw prevails and it rolls into month 4.
**In sales speak, this is often referred to using the bowling term “the bumpers are coming off.”
***Any sales professional in a startup role will request a non-recoverable draw. This is valid because they are not aware of the risks they face, and in a hyper growth new role, there is plenty of risk. Compare this to a more traditional sales role in which the person takes over an existing/developed territory that brings in 80% of goal due to brand name recognition.
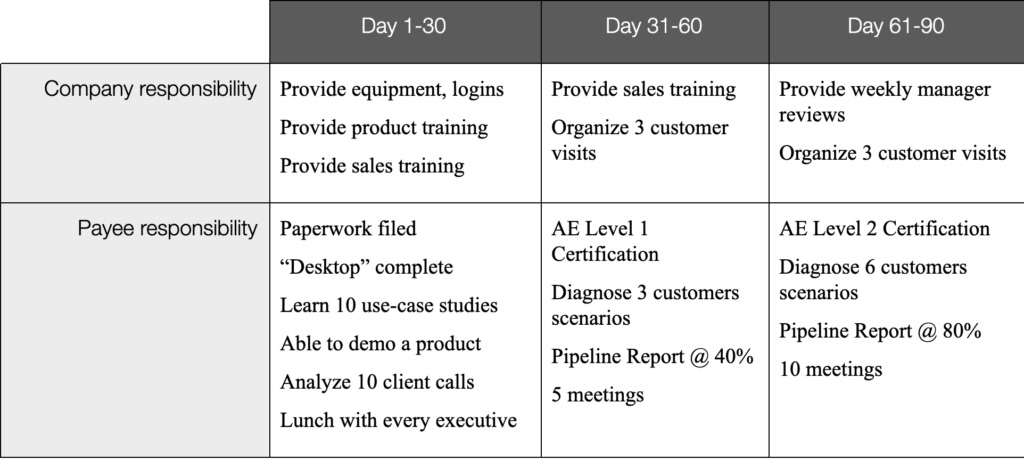
Table K. 90-day onboarding program to make new employees “earn” the non-recoverable draw
Step 8: Sales Development Rep Compensation
To apply each of these compensation models when hiring a SDR, consider the following assumptions:
$40,000 in variable compensation needs to bring in enough deals to win 30 deals per year.
SDR Assumptions:
deals with an ACV of $30,000
|
Linear Model: In this case, the SDR is closing 30 deals per year with a 1:5 win rate (this is the norm in SaaS sales vs. 1:3 in perpetual sales) which equates to 150 leads per year. $40,000 divided by those 150 leads equals $267/SQL, or rather $250/SQL. As the SDR generates 12 SQLs per month, that will equal $3,000 in commission. This also means that for every deal won at an ACV of ~$30,000 at a 1:5 win ratio, you will have to pay for 5 SQLs, which will cost your company $1,250.
In comparison, it is common to pay an external firm $500 for every meeting generated and $1,000 for every meeting set with a decision-maker. A referral fee of 5% ($1,500) is also common for an introduction at the manager/VP level or 10% ($3,000) at the CxO/Board level.
Accelerated Model: You can use this model to drive behavior toward qualifying the right deals. Plan to spend $1,250 for 5 SQLs since this is what the business model states above, but pay less per SQL. For example, $150 instead of $250 each. That means you will pay $750 total for 5 SQLs @ $150 each, which leaves you with $500 remaining, so you can now pay out $500 for every deal closed. In this case, you end up paying the same amount but drive behavior to identify quality SQLs.
Business Model: To drive behavior toward the opening of a new market, offer $150 for a medical company but $250 for a financial institution. To drive your team to reach seniority, offer $100 for a meeting with a manager and $150 for a meeting with a CxO/VP title.
Importantly, the definition of SQL and SAL needs to be clearly defined in either the compensation plan or printed on a poster on the wall of your company where it is clearly visible for all team members to see. Be sure to give examples to your team of what constitutes an SQL, but also remember to give them examples of what does not constitute an SQL.
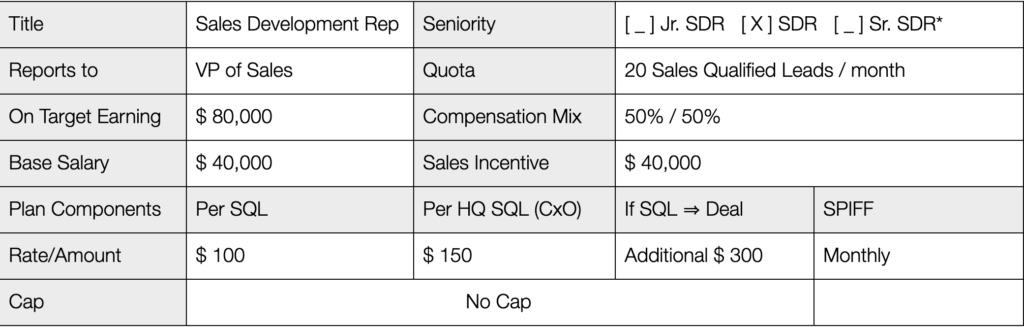
Table L. Example compensation plan for SDR
*A junior SDR is often the same as a Marketing Development Rep calling on inbound leads only, whereas the senior SDR is often the same as an Account Development Rep calling on fewer targeted accounts along an ABM campaign.
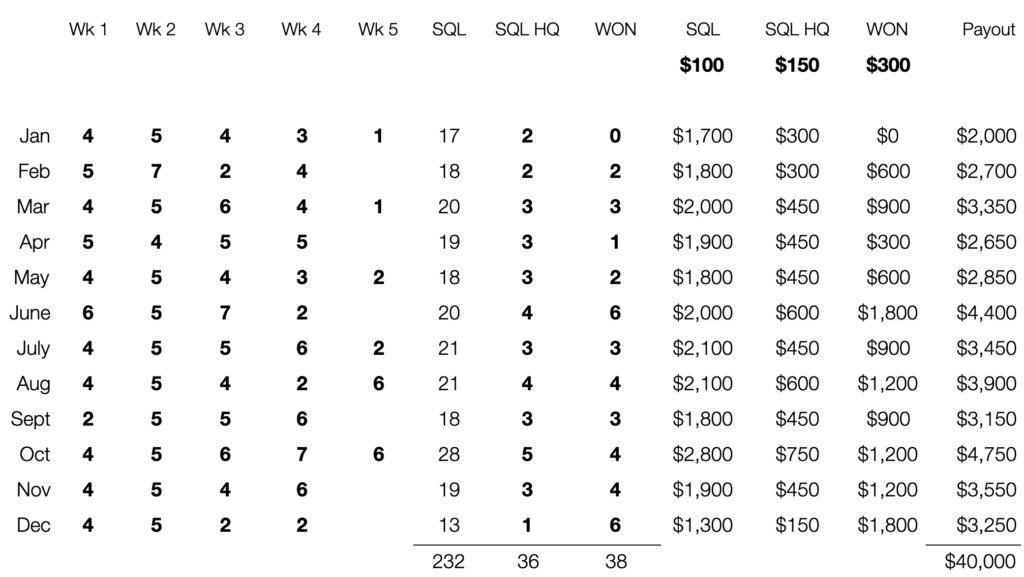
Table M. Example compensation payout for SDR
Split Model: The SDR role is often under pressure because their compensation plans are held accountable against market metrics that frequently reset themselves. Whereas a few years ago, generating 30 to 40 SQLs per SDR per month was quite feasible, today the figures are closer to 10 to 15 SQLs per SDR per month, though this fluctuates with different markets, regions, etc. Due to the lower SQL count, you may follow the model and conclude that you need to compensate your SDR $500 or even $1,000 per SQL, however, such a high value per SQL invites the SDR to take advantage of the model. In such cases, you should split the model by reducing the price per SQL to $200-250, and then adding compensation for productivity in the form of number of emails, calls, event sign-ups, visits to trade show booths, etc.
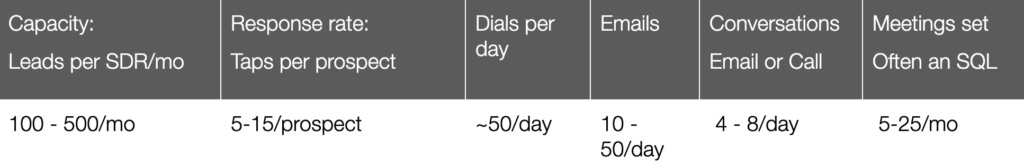
Table N. Metrics to consider in SDR compensation plan
Quality vs. Quantity: To generate volume, you can compensate based on SQLs for meetings set. This, however, may lead to an influx of unqualified deals. To set a standard for performance, the AE can accept the lead, turning it into a Sales Accepted Lead (SAL), which offers you three options to guarantee quality:
- Compensate on SQLs, but lower the price per SQL from $100 to $50. Note that you are wasting AE resources if they have a lot of unqualified calls.
- Compensate on SALs instead of SQLs. This reduces the velocity, but creates a strenuous relationship between the SDR and AE, as the AE may disqualify deals that SDR worked hard on.
- Add a Quality Measure. Shift the gravity of the compensation within the compensation plan. For instance, $50 per SQL + $500 per deal won.
- Claw back commission at the end of the month by taking out all deals that did not turn into an opportunity.
Account Development Rep Compensation
Account Development Reps (ADR) are different from SDRs in that ADRs focus on key accounts or targeted accounts. They are often responsible for implementing Account-Based Marketing (ABM) campaigns as well. The compensation of an ADR is different because it is focused on a fraction of the accounts. This role has three key elements – Activities, Engagement, and Impact – which can be distinguished from the roles of an SDR, as displayed in Table 8.15.
If you have a group of Development Reps, you may have to combine a variety of these tasks across roles and across time. For example, a major annual event such as an industry trade show may influence the way you compensate each role.
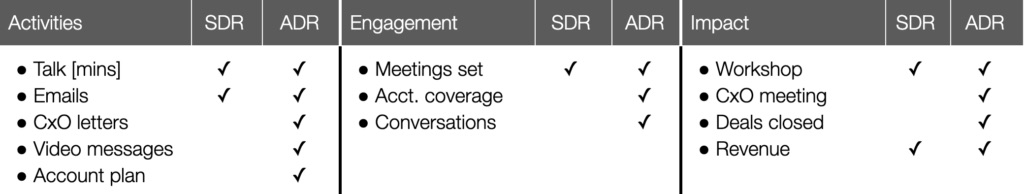
Table O. Differences between SDR (outbound) and ADR (targeted accounts) compensation plan
Typically, a rapidly growing firm will compensate SDRs as follows:
- Outbound Target: By Sales Accepted Leads (SAL) created by outbound campaigns (1 to a few). Generation of these SALs are based on call volume MBO (management by objectives).
- Account-Based Marketing Target: By Sales Accepted Opportunities (SAO) created by ABM campaigns (targeted accounts). SAOs are tied to setting up calls/meetings with people within these accounts.
- Event Target: By meetings set at events. For example, for large events such as Dreamforce, a quota is added for meetings, e.g. “Book 10 meetings a day at Dreamforce.
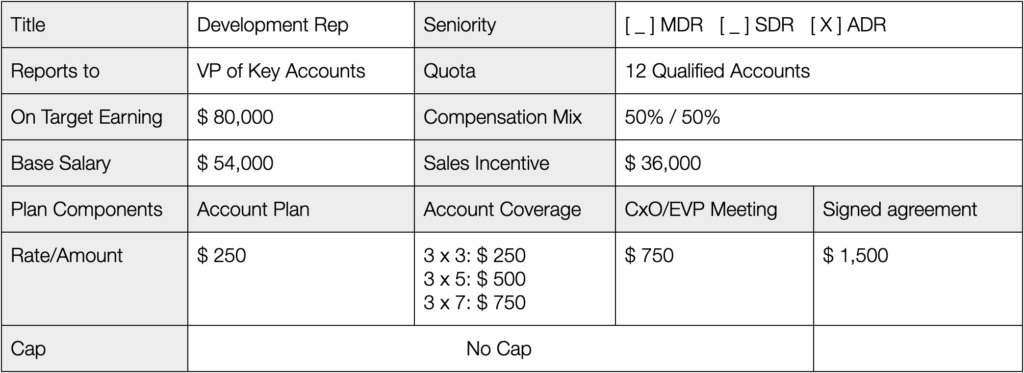
Table P. Example Compensation Plan for ADR
Step 9: Items to Include in Sales Incentive Plan
The Sales Incentive Plan that you agree to with your employee should include or specify all of the following terms, tailored appropriately to your business needs:
Monthly vs. Quarterly Payments: Evidence clearly shows that monthly payments reduce “the hockey stick effect” or the scenario in which 50% of all sales come in the last two weeks of the quarter. There are very few exceptions to this rule.
Payment: With 50% of compensation based on commission, you must pay compensation on time with the same due diligence as any other salary compensation. The industry norm is one payment cycle after the quarter closes (e.g. within 30 days of the month’s close).
Capping: If capped at $400,000 annually, this means that even if total compensation exceeds $400,000, the team member will not get paid above $400,000. This is a common practice for companies in which strategic deals have a large team working on them. For example, a Fortune 500 company may choose to deploy an enterprise-wide solution following a series of meetings at your CEO/VP’s office that the AE was not part of. In this case, the AE should be notified that capping may apply.
Override: To overcome unknown scenarios, all compensation plans should contain an override by the CxO/VP. For example, if a sales team falls $400k short on quota, the CEO may work with a board member to have a portfolio company “buy” the product/solution in order to overcome the shortfall. This is a situation in which the override authority might be enforced.
Fair Compensation: Sales has been an alpha-centric job for decades, therefore, sales compensation receives a lot of scrutiny with regards to equality in gender, age, race, etc. At the same time, it is common practice for a VP of sales to bring in a former sales performer or individual contributor at an increased pay rate since they are a known entity. As another performer is let go to make room for the “top performer” (or due to his or her underperformance), there may be grounds for a lawsuit. Regardless of the performance of the former contributor, if he or she was not fairly compensated during his/her tenure, there will likely be grounds for a lawsuit.
Fair Compensation Board: It is strongly recommended that portfolio companies with more than 25 people establish a Fair Compensation Board which contains the CEO, an internal executive, an industry expert (often a board member), and an external HR professional who agree to quarterly review compensation and ensure fairness. This not only protects against hiring people at overly large compensation rates, it also allows underrated top performers to get noticed and put on an accelerated career path.
Step 10: Draft a Two-Page Contract with Mutual Commitment
The following page contains a sample Sales Incentive Plan that may be used as a template with new hires:
Sales Incentive Plan
Revision Date: June 23, 2017
This document describes the agreement between ______________ (“Company”) and ______________ (“Payee”) regarding terms related to sales incentive compensation. Company and Payee enter into this agreement whereby Payee provides services to the Company in return for compensation specified in this agreement.
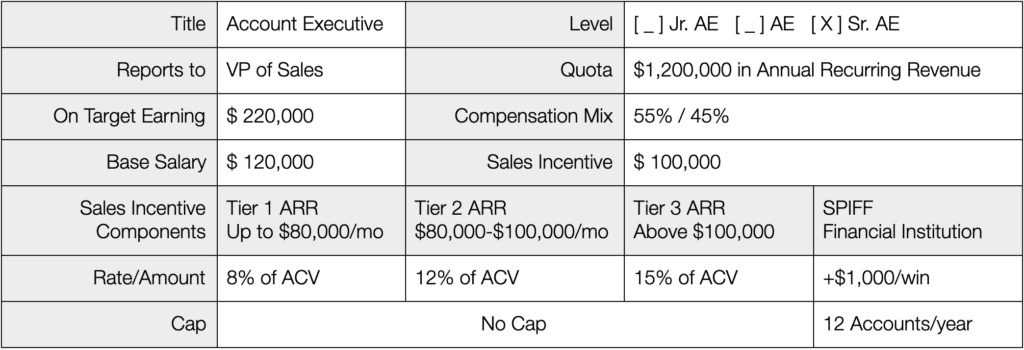
Table 1. Overview of the Payee Compensation Plan
All commissions will be calculated and paid once every month, for the preceding month. Commissions will be calculated and paid out as part of the next payroll cycle, following the month for which commissions are calculated.
Base Salary Payout – Sales Rep is due a base salary of __________, payable every __________.
Sales Incentive Payout – Sales incentive compensation is payable every __________.
Expenses – The Account Executive will be paid for all travel and lodging expenses related to sales activities within 30 days of being presented with the receipts and a completed and accepted expense reimbursement form.
Travel and Lodging:
Auto Travel Reimbursed at the current federal reimbursement rate
Cell Phone Sales Reps will be required to maintain a cell phone as part of conducting sales business. Sales Rep will be provided an allowance of $50 per month for cell phone usage.
Client entertainment expenses will be reimbursed as follows:
Meals/Coffee Reimbursable with receipts
Special Events Must be pre-approved. Reimbursable with receipts
Draw – Payee receives a monthly non-recoverable draw against the sales incentive plan as follows based on the participation and completion of the 90-Day Onboarding Program.
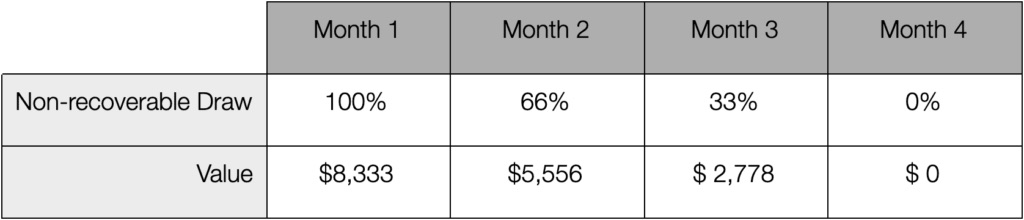
Table 2. Eligible Draw Month-over-Month
Clawback – In order to receive your full commission with no clawback, the customer must stay live for 3 months from the day we start billing the customer. If a customer cancels short of the 3-month mark you will have a prorated amount clawed back from your commission against the sales made.
Draw Clawback – If Payee voluntarily leaves the position within the first 6 months of this plan, the Draw payment(s) will be due back to the Company through a payroll deduction from any monies owed to Payee.
Splits – Commissions can be split with other Payees, on a deal-by-deal basis at the discretion of the VP of Sales.
Termination of Employment – On voluntary or involuntary termination of Payee’s employment with the Company, commissions will be paid on transactions dated prior to the termination date only. Any amounts owed to the Payee will be according to employment regulations after withholding taxes and other dues.
90-Day Onboarding Program – The onboarding program will take place over 90 days and the following activities are expected from the Payee to be eligible for the Draw as outlined in Table 2.
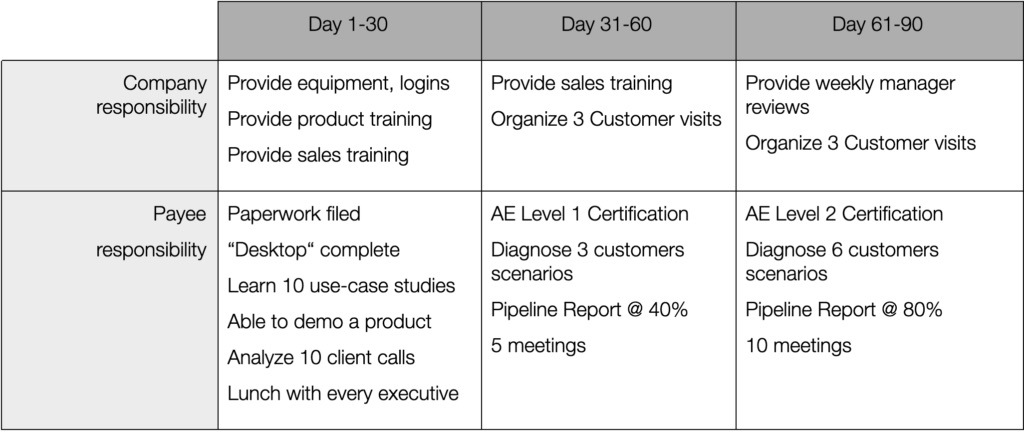
Table 3. 90-Day Onboarding Program
Other Important Terms
- Payee agrees to follow all federal and local laws while engaged in providing services to the Company during the period of this agreement.
- Payee shall not engage in any other employment during the term of this agreement. Company reserves the right to require Payee to terminate any such other employment at Company’s sole discretion.
- Payee shall use the most ethical practices while engaging in any sales activity.
- Payee agrees to protect all confidential material including prospect data, sales data, and client information belonging to the Company and shall take all reasonable care in making sure that such confidential material is not disbursed to anyone outside the company.
- This entire agreement shall be governed by the laws of the State of _______________.
- VP of Sales reserves the right to override the terms of this agreement without cause.
Company / VP of Sales
By: ________________________ Title: _______________________ Date: _______________________ |
Payee / Sales Rep By: ________________________ Title: _______________________ Date: _______________________ |
The data that drives the SaaS methodology model can be categorized into three types: volume metrics, conversion metrics, and absolute time metrics. Each of these work in systems to drive the different stages of revenue generation: customer acquisition, recurring revenue, and lifetime value.
Measuring Data
Many organizations are excited about the amount of data flowing into their customer relationship management (CRM) or marketing automation systems (MAS). Despite the influx of data, however, many organizations are also uncertain how to interpret and best utilize it. There is a tendency to compare apples to oranges, which results in either no action or bad action which has an adverse impact on the business.
Most decisions in sales today are guided by data, so a company must establish the correct data model for itself. Companies must ensure they are measuring from the same point and comparing against the same criteria in the same way. Start by standardizing exactly what your company is going to measure.
Figure 1. The Recurring Revenue Model
The SaaS Methodology Data Model
The Recurring Revenue Model is a customer-centric model based on seven unique customer experiences during the stages of the sales cycle, as shown in Figure 1 above, and it is the backbone of SaaS Methodology. There are three types of metrics that contribute to the SaaS Methodology data model:
- Volume Metrics. These will measure how much volume, such as leads, deals, etc., your company has.
- Conversion Metrics. These will measure how many inputs are needed to generate the desired output.
- Absolute Time Metrics. These measure how long it takes to convert input into output.
Figure 2. The SaaS Methodology is a scientific model that uses three types of metrics
Volume Metrics
Volume metrics are quantities of items (such as the number of leads, commits, or revenue) present or generated at any given step in the sales process. See Figure 3 and Table A for the different volume metrics and their respective definitions.
Figure 3. Volume metrics throughout the sales process
Table A. Volume metrics defined
The Order of SQLs vs. SALs
The typical diagram of a Sales Qualified Lead (SQL) in a sales funnel will depict a process whereby marketing delivers Sales Accepted Leads (SALs) and then sales qualifies them as SQLs. This is the wrong order. In sales, you should qualify first and then accept. When sales accepts a lead, it is held accountable for the win rate and the sales cycle. See Figure 4 for a visual representation of the correct order. To clarify the process, the figure uses an emergency room visit as an example because hospitals are analogous in that they expand the quantity and quality of resources based on the diagnosis. Table B shows questions to ask at each step of the sales process.
Figure 4. Correct depiction of Sales Qualified Lead before Sales Accepted Lead
Table B. Questions to ask at each stage of the process
Conversion Metrics
Conversion metrics measure the volume of the output of a process divided by the volume at input. They indicate the rate at which you are converting at each step. See Figure 5 and Table C for conversion metrics throughout the sales process and their respective definitions.
Figure 7.5 Conversion metrics throughout the sales process
Table C. Conversion Metrics defined
The Importance of CR3 and CR4
When looking at the conversion rates, CR3 and CR4 stand out. CR3 refers to how many meetings were set for the sales team versus how many of those turned into an opportunity (also known as the sales pipeline). There are two reasons why this is not 100%. First, there are no-shows, or prospects who commit to a meeting to get you off the phone but do not show up to the meeting. Second, there are unqualified leads, or prospects who upon further review cannot be helped by the company’s product at this time.
In the case of a two-stage organization, the prospector (SDR) had a short conversation with the client who agreed to a discovery call with the sales manager or account executive (AE). CR3 and CR4 (win rate) are particularly important as they provide insights into team efficacy and where it can be improved. See Table D for suggestions based on these two conversion metrics.
Table D. How CR3 and CR4 conversion metrics can diagnose sales issues
Absolute Time Metrics
Absolute time metrics are defined as the delta in the time it takes to convert one volume metric into another volume metric. See Figure 6 and Table E for absolute time metrics throughout the sales process and their respective definitions. The length of time it takes to convert one metric into another is determined not by the actual activity in the process but by the waiting time in between the processes. For example, it may take five minutes to write an email invitation to an event, but it can take days to get a response.
Figure 6. Absolute time metrics through the sales process
Table E. Absolute time metrics defined
Fast Response Times Can Backfire
One of the most common marketing mishaps involves an inbound lead or MQL. When a client reaches out, they generally have a pain that motivated them to do so. In that first conversation, the seller should make sure they are fit before scheduling a discovery/demo call. An inbound call is time sensitive, and the faster the response, the higher the chance of a successful outcome.
Viewing it from the buyer’s perspective, they have finally found the product they want to purchase but they cannot get it until they “talk to someone” on the seller’s side. They leave their phone number, enter their email address, and wait for some to contact them. B2C metrics say that the majority of people spend five minutes (at most) waiting for a response or checking their inbox for a reply [Ref. 1].
Drift, a company that specializes in customer web chat, performed research which showed that as of mid-2018, only 7% of 433 companies contacted responded within five minutes. Even worse, 55% of the companies did not respond within five business days [Ref. 2].
Figure 7. Inbound vs. outbound processes: fit and pain are reversed, causing the wrong, time-sensitive response
In general, an inbound process consists of a series of actions such as sending an email, making a phone call, and leaving a voicemail. As an example, many people experience this process when reaching out to a dentist.
However, this time-sensitive process is often used in the wrong circumstances. For instance, if a client provides an email address so that they can download a research paper from your website, in many cases, this lead will be miscategorized as an MQL. As a response, the sales development rep calls the prospect immediately, leaves a voicemail, and sends a follow-up email as if the client has expressed a pain – but they never did. Now, the client feels intimidated by the assertive follow-up.
Companies must learn that not every MQL is created equal. In this case, the MQL should have gone into the outbound process, during which research would have been performed to determine if this client had a pain the company could solve. See Table F for more examples of true inbound leads compared to quasi-inbound leads.
Table F. Examples of true- and quasi-inbound leads and appropriate responses
Sales as a Science
All sales leaders have been in situations where their sales team is falling short of its targets. In that circumstance, most tend to respond by thinking about how many more deals they must add to meet that target. The more sophisticated among them may also consider how many more incremental meetings, sales opportunities, or marketing qualified leads they need in order to achieve that goal. In other words, most sales leaders are thinking in additive terms, which is a result of each department working by itself with an individual additive goal. This is more commonly referred to as “operating in silos.”
Generating revenue is not a one-time event that happens in one meeting, performed by a single person. Rather, revenue is the product of connected events across a series of meetings, working together in a system that is run by several people. This system is based on connected revenue propulsion systems that operate during three different stages:
- Stage 1: Acquire Customers
- Stage 2: Achieve Recurring Revenue
- Stage 3: Extend the Customer Lifetime
Figure 8. Example of the Acquisition Process: a series of activities form the processes that work together as a system
Stage 1: Customer Acquisition & System Impact
During customer acquisition, there are typically four different processes at play, as depicted below in Figure 9. Each process is based on a series of interactions, and each of these interactions has a conversion. The end result of the entire Customer Acquisition process is the product of these conversion rates (CR).
For a practical example that illustrates these processes, consider a high-velocity prospect who visits your company website. Following some browsing, she likes a white paper and enters her email address to gain access. As she is reading the paper, she receives an invitation to attend a webinar with an expert in the field. She signs up for the webinar, and with that action, she becomes an MQL. Unfortunately, she is unable to attend the webinar.
The day of the webinar, she goes back to the website where a chatbot welcomes her back. The chatbot knows she was unable to attend and asks if she would like to watch the recording. She likes this idea and watches the condensed version of the webinar. The chatbot then asks if she wants to set up a discovery call. She says yes and is linked to a live chat with Mike, the SDR. Mike learns her name is Nikki and suggests a few time slots to meet. Nikki picks a time and receives confirmation via email. She has now become a SQL.
The next day, Nikki dials into the discovery call where Mike introduces her to Yuri, the AE. Yuri diagnoses Nikki and concludes the company can help her. She has now become a SAL. Yuri suggests a real-time demonstration. Nikki loves the demo and asks for the price. Yuri offers a range of prices based on her exact needs, and together they hone in on their options. Nikki asks for a proposal so she can take it to her organization. A few days later, both parties meet to review the proposal. Nikki has invited the VP of Finance who seeks agreement on a few terms.
The next day, the agreement is executed, and a kick-off is scheduled. During the kick-off, Nikki adds the Director of Sales Ops who integrates the service into their cloud suite. On Monday, she and her team are live.
Figure 9. High-velocity sales based on web visitors
How to Calculate Acquired Monthly Recurring Revenue
Figure 9 displays the steps that prospects – who begin as website visitors – progress through during the sales process. These steps are accompanied by sample conversion rates, prices, and discounts that a company might achieve or create during the Customer Acquisition stage. The formula for calculating Monthly Recurring Revenue, known as MRR(New), based on website traffic is as follows:
By improving the performance of each conversion rate independently, the impact on newly acquired Monthly Recurring Revenue can be measured. Table G below demonstrates the impact of improving a single conversion rate, CR2, on MRR(New). This example is based on 1,000 prospects. CR2 is the conversion rate between MQL and SQL, which is the result of a call or email by a sales development rep in a high velocity sale.
Table G. Change in MRR(New) as CR2 increases
With this single percentage point improvement, the impact on MRR(New) is five percent. As an example, such an increase in performance could be the result of the use of an online chatbot. However, not every improvement creates the same results. Some improvements impact results in a much larger way. For example, with win rate and discount, their impacts are greater as they occur within a much smaller data set.
Win Rate: In sales, there has been a big change in win rate since the once-standard 1 in 3 of Enterprise Selling. Today, the average performance is about 1 in 5, with the best in class operating at a win rate of 1 in 4 [Ref. 3]. See Table H as an example of the effect that an increased win rate (C4) has on new Monthly Recurring Revenue.
Table H. Change in new MRR(New) as CR4 (win rate) increases
Discount: Recurring revenue models were never designed for discounts. In a way, compared to the previously used Perpetual Business Model, they are already the discount model. To make matters worse, many companies have fallen into the habit of discounting prices at a set rate of 10% or 20%. Large increases in discount levels have a pronounced negative impact on the new Monthly Recurring Revenue generated by the company. Table I provides an example.
Table I. Change in MRR(New) as discount decreases
As you can see from these results, in terms of individual conversion rates, win rate and discount level have the most pronounced impact on newly acquired Monthly Recurring Revenue. This impact is displayed in Figure 7.8 below.
Figure 10. Discount level and win rate impact on MRR(New)
System Impact: Small Changes Equal Big Results
In this cohesive system which is impacted by a series of conversion metrics, the major realization and actionable lesson for companies is this: When you improve each conversion metric by just a small amount, the recurring revenue stream nearly doubles, even when using the same number of prospects (1,000). This is known as “system impact,” and the results can be seen in Table J and Figure 11.
Table J. Results of incremental changes in conversion rates (CR) on MRR(New)
Figure 11. System impact shows small improvements result in 2x MRR(New)
At the system level, revenue organizations work multiplicatively rather than additively. The effort and results of each link in the sales chain are magnified or diluted by the next. Therefore, massive changes in outcomes are possible by making marginal improvements across the chain rather than by simply improving any one link.
Despite this fact, most sales leaders are of the mentality that they could not improve sales by 2x without increasing the top of the funnel, but they would likely sign up to improve their discovery call conversion rate by 10%.
Stage 2: Recurring Revenue & Compound Impact
After learning how to double the recurring revenue stream with incremental changes, companies should next focus on creating a compound impact from their revenue using Churn and Upsell metrics. The following examples begin with a monthly model and proceed to an annual model.
Churn: In the Recurring Revenue stage, not every customer comes back. This is normal, and it is referred to as “churn” (CR6). Unlike the Customer Acquisition stage of business, this stage experiences a different growth formula, which is used in nearly all areas of finance, known as Future Value (FV).
FV incorporates a compound element based on a period(s) of the interval measured over time, as follows
Table K shows the impacts of periodic churn on revenue based on a 12-month contract:
Table K. Impacts on revenue based on changes in churn rates (CR6)
Upsell: Companies not only experience periodic churn, they also increase periodic upsell, which is a situation in which the client increases the contract value every month. Table L shows the effect that different upsell percentages (CR7) have on revenue when combined with changing churn rates.
Table L. Impacts based on changes in upsell (CR7) and churn (C6)
Below is the growth formula for annual recurring revenue value in which the period is 12 months:
Because Customer Acquisition (Stage 1) and Recurring Revenue (Stage 2) are based on different growth formulas, they achieve different impacts on company revenue, as depicted in Figure 12.
Figure 12. Growth in Stages 1 and 2
Annual vs. Monthly Contracts
The growth formula for annual recurring revenue, known as ARR(Growth), requires companies to distinguish between two very different business models:
Monthly Contracts: For businesses that work on a monthly contract (such as a monthly subscription with an online storage company), churn is about 1 to 2% per month [Ref. 4]. Upsell can vary greatly, though it generally exceeds churn, and the period over which it happens may be anywhere from nine months to several years [Ref. 5]. For B2C examples, consider a monthly phone subscription or monthly Amazon bill, while B2B examples include a company’s storage, monthly leads, etc.
Dashboard Example – Usage MRR: This type of growth is primarily achieved by growing new revenue from existing customers based on usage (examples include companies that provide templates, content, storage, leads, etc.). In this case, businesses can grow a lot faster with the same amount of customers, but in turn, they are more prone to churn, as customers can turn off or downsize their usage overnight. In these types of businesses, revenue churn averages between -1 to -2% per month [Ref. 6]. As shown in Figure 7.13, most of the growth comes from usage/consumption rather than new customer accounts.
Figure 13. MRR dashboard usage shows most growth comes from usage/consumption
Annual Contracts: Businesses that utilize an annual contract function based on a number of seats. For example, Google Suite, Customer Relationship Management, or Marketing Automation System licenses. For these types of platforms, annual churn is 6 to 7% [Ref. 7]. The upsell is comprised of a lift or increase in the annual platform price, usually by 5 to 10% [Ref. 8] as well as growth due to an increase in the number of seats. In this case, the period is measured by the length of the contract (for example, three years) which is also known as Average Contract Length or ACL.
When you calculate out this formula and then begin to make small improvements, the reduced impact that they have is noticeable, as shown in Table M. This is due to the reduced number of time periods, as they are now being measured in years rather than months.
Table M. Impacts on revenue based on changes in churn, price increase (lift), and growth
Dashboard Example – Annual Contracts: This type of growth is primarily based on securing new revenue from newly acquired accounts and renewing them at an annual increased rate. This growth chart is very common when companies sell a platform for which the price is based on the number of seats, as described above. Although the number of seats may grow, for most companies, it often grows at a relatively small percentage rate [Ref. 9]. Revenue churn for these types of businesses is between +5 to 7% [Ref. 10], but it is often related to Logo churn (the percentage of subscribers that discontinue their subscription) which is -6 to -7% annually. As shown in Figure 14, most of the growth for these platforms comes from additional seats and price increases.
Figure 14. MRR dashboard growth from platforms – most of the growth comes from additional seats and price increase
Stage 3: Extending the Customer Lifetime
Average Contract Length is a time metric that provides a key element for the third and final stage of revenue generation. In this stage, companies should measure the impact created by the length of the customer contract (ACL).
By using the monthly growth formula and measuring the average length of the contract (in this case, p = ACL), you can calculate the expected annual lifetime revenues, known as ARR(LTV). With this formula, companies can determine the impact of increasing the contract length by a single month and then compare it to their previous pipeline. See Table N for the results achieved by increasing the ACL.
Table N. Impacts based on changes in ACL
Extending the customer lifetime has a profound impact on a company’s total revenue. Figure 7.15 displays a comparison of the different impacts achieved across Stages 1, 2, and 3 of revenue generation.
Figure 15. Growth Stages 1, 2, and 3 show pronounced impact based on an extended customer lifetime
he results show that 3x revenue can be generated using the same amount of prospects with a monthly subscription model simply by making small improvements across the entire lifecycle of the customer. The biggest impact, however, occurs post-sale when $15,840 in monthly recurring revenue can be turned into $467,686 of lifetime value. Unfortunately, this is an area where companies commonly spend the least amount of quality resources [Ref. 11].
Such an improvement does not happen through a change in hiring practices, but rather through a shift toward approaching sales as a system and implementing processes that, with small improvements over time, will maximize impact.
A Future Metric: Identifying the Customer Early On
There may also be a need for a fourth growth stage based on the fact that not every customer is created equal. Though there is no formula yet, when a successful business looks back to identify the moment it “took off,” it can typically categorize customers into one of three variants of a symbiotic relationship:
- Mutualism: Relationships in which both parties benefited. This is the lionshare of customers. From the beginning of the relationship, each party was committed to the success of the other. Not much occurred beyond the conveyance of revenue and perhaps the display of a logo on a website.
- Commensalism: In this relationship, the seller clearly benefited, but at no cost to the buyer. Examples of a commensal relationship might include a customer who spread the word about a product by mentioning it was critical to their success, a customer who helped the seller discover a new vertical market, or a customer who invited the seller to speak at an event filled with qualified buyers.
- Parasitism: Relationships in which one party significantly benefited at the cost of the other. Most commonly, it is the seller who benefited from financial gains, whereas the buyer never received the impact they were promised. These accounts often churn at the end of the contract.
The most dangerous relationship for a new company is parasitism camouflaged as commensalism. Many CEOs make the mistake of thinking that a big brand name will act as a force multiplier, but research shows that large multinational customers often cause harm to a seller because they demand the most valuable resources of a company during the critical phase of rapid growth [Ref. 12]. These large customers often require long business trips by founders and knowledge transfers, which are followed only by the RFQ and an invitation to participate in a bidding war.
For this reason, it would be beneficial if companies could recognize up front whether the seller-buyer relationship would result in mutualism, commensalism, or parasitism. With a system based on data in place, this could eventually be a reality. As soon as the system recognizes a specific marketing campaign results in huge success (for example, a SEO term), it could allocate more funds to that SEO term. If the win rate, sales cycle, and average contract value of a vertical market indicates improved effectiveness, it could prioritize lead campaigns or even prioritize SQLs to intensify efforts. This is referred to as a “closed loop system.” Figure 7.16 provides a visual display of sales as a closed loop system.
A closed loop system is a system that regulates itself based on feedback. These types of systems form the basis for every artificial intelligence system in the world. Their implications on sales the world of sales, however, will require much further exploration and research.
Figure 16. Sales as a closed loop system, a foundation for artificial intelligence
Summary
To get the most value out of data collection, companies should leverage an established data model for recurring revenue generation which provides three kinds of metrics: volume metrics, conversion metrics, time metrics. These metrics dictate three stages of growth:
- Customer Acquisition: This stage generates system impact, which consists of small improvements to the conversion rates across the board to create a bigger overall impact, as opposed to a great impact on a single conversion metric (such as win rate); often person-driven.
Formula: MRR(New)= Prospects n=15CR[n]Monthly Fee
- 2. Recurring Revenue: This stage establishes a recurring revenue stream that creates a compound impact based on churn and upsell metrics. If the impact is felt monthly (versus annually), a more rapid increase or decrease is possible as the impact compounds over the number of periods (p).
Formula:
ARR(Growth)=MRR(New) (1+CR6+CR7)p
- Lifetime Value: The later, post-sale stages of revenue generation, during which exponential growth provides a disproportionate amount of revenue. By extending the average contract length (ACL), a company earns a disproportionate amount of profit.
Formula:
LTV=MRR(New) (1+CR[6]+CR[7])ACL
In many companies, most of the quality and volume of resources are applied to the customer acquisition processes, primarily to two conversion rates (CR2 and CR4). However, a company’s success depends on a system in which profits are generated due to growth of recurring revenue over an increased customer lifetime. In many cases, this is where the least amount of quality resources are applied.
The number of roles within the marketing, sales, and customer success teams at SaaS companies has become quite confusing in the last several years as organizations have embraced new org models of role specialization, and put their own spin on them.
.
It’s further complicated by the fact that these roles are still being reinvented as SaaS orgs evolve along with the new technology they are using to power their teams.
Let’s review how to make sense of these roles: we’ll go through how we should think about these stages, and how to define roles and responsibilities across each stage. Teams may have slight variations depending on your business model, but these principles should apply across the board as you are defining your go to market organization.
.
STEP 1. NORMALIZE STAGES
In 1898, Elias St. Elmo Lewis developed a model that mapped a theoretical customer journey from the moment a brand or product attracted consumer attention to the point of action or purchase. He created a four-stage process: Awareness, Interest, Desire, and Action (AIDA). This term was made popular when it was famously enacted by Alec Baldwin in the cult classic film Glengarry Glen Ross. In the AIDA model, revenue and profits are realized shortly after the client signs a contract. Many sales and marketing organizations still are based on a version of AIDA, which today is referred to as “the funnel”.
Figure 1. The Marketing & Sales Funnel, evolved from AIDA
With the advent of recurring revenue models, the conventional layered funnel depicted above became outdated – because it was designed from the seller’s perspective, not the buyer’s. To further complicate things, it created a siloed approach in which individual teams focused on their own narrow performance metrics at the expense of others in order to hit their targets.
Figure 2. Bowtie model with stages based on customer experiences
We visualize this new model as a ‘bowtie.’ The bowtie must cover two critical gaps: 1) the impact stage where sellers must ensure that customers achieve their expected impact; and 2) the critical activity of growing the business together with your customer. These two additional stages create a compound growth loop. In comparison, a funnel model was designed to achieve linear growth without a growth loop.
STEP 2. DEFINE RESPONSIBILITIES BY STAGE
As described in the book The SaaS Sales Method: Sales as a Science, a high-velocity business must operate as a system. This means that departments must operate with each other flawlessly, and not as siloes.
What this means is that every team has a role in each stage of the sales funnel; the amount of involvement of course varies in each stage. For example, Marketing must be involved throughout the entire sales process – not only in the awareness stage. And Customer Success should be involved before the customer commits, if you want to have a successful handoff from sales to CS and a great experience for the customer.
The exact levels of involvement will vary from business to business; you should determine how each department needs to be involved at each stage, and with what kind of action.
.
STEP 3. ASSIGN ROLES ACROSS STAGES
The degree of specialization that you should have in your organization is generally a function of the Annual Contract Value (ACV). For example, at a lower ACV of $2,500/year, you would likely have a full inbound funnel with an online credit card transaction. Compare this to higher ACVs, say $50,000, may involve a response to a request for a proposal, discovery calls, and even a proof of concept.
This specialization is in response to what the customer values. At a lower ACV, customers value a seamless working product operating in a standard workspace (think of a Google Chrome plug-in). At higher ACVs, they value a high-touch service that helps with deep integration into the customized environment (think of a sales automation platform).
When well executed, job specialization can increase sales velocity and improve effectiveness. Organizations need to ensure that specialization is paired with a well-defined, cross-functional process and job training for each role, with proper handoffs.
Figure 4. Assign roles to match your GTM model, for each market segment. Shown in brackets is the number of accounts called on by role such as (100 accounts) or (less than 40 accounts).
STEP 4. DEFINE EACH ROLE
Having determined the roles, we can now provide some insights as to what each role does and how the roles differ from one another.
Group 1. Sales Development Roles
MDR – Market Development Rep. This role generates a sales qualified lead (SQL) primarily by having a conversation with an inbound marketing qualified lead (e.g., following up on demo requests or form fills to speak with sales). Other areas of responsibility include confirmation of attendance to events such as webinars and trade shows. This role is often most meaningful in inbound businesses, since the role reports to marketing.
SDR – Sales Development Rep. This role focuses on a region or vertical in which they develop sales qualified leads from scratch. This means they have to start a conversation and provoke a decision maker into action, handle objections, and close on a call-to-action such as meeting with an account executive (AE) or attending an event. Due to the sales-like skills required, this role should generally report to sales.
ADR – Account Development Rep. This is a highly specialized SDR role. While the SDR focuses on going after a single role in thousands of accounts, the ADR is responsible for implementing account based prospecting and targeting multiple people inside the same account, across a few dozen accounts. The ADR is the most senior of the sales development roles. They often have to target executives using provocative sales techniques, and to be successful, they must have a deep understanding of use cases based on the impact achieved by clients. This role can report into the account manager (AM).
BDR – Business Development Rep (not depicted). This role generates sales qualified leads in volume from a partner such as Salesforce and the AppExchange. The role of the BDR is to provide lots of support to the partner, organize events, provide content, create a template quote, etc. It should be no surprise that originally this role reported to the business development executive, but today, it is more common to see this role reporting to the channel manager. In the past years, this title has sometimes been used to apply to the SDR role, to minimize the bad mojo from the “sales” part of the title.
Group 2. Sales (signer) Roles
SM- Sales Manager. This role is responsible for all business within a territory or vertical market. This role might cover a wide geographic region, and in that case, would be an inside role rather than a field role (not traveling to visit customers). Instead, they organize local events such as meet-ups to network with clients and mix them with existing customers.
ISR- Inside Sales Rep. This role combines the MDR (inbound) and SM (closing) roles. This role is commonly found in high-velocity sales, where the client can demo the product on their own online through an automatic free trial, and then approach the ISR with the intent to buy. As such, the ISR can manage up to a hundred clients a day (10-20 per hour). The primary role of the ISR is to field an inbound call, address a client’s concern, provide accurate pricing, and obtain commitment.
AE – Account Executive. This role generally will get a vetted list of 20 to 100 named accounts to focus on. They use both provocative and solution sales techniques to start a conversation, and they develop a deeper understanding of the client’s needs through extensive research and discovery calls. They develop multiple touchpoints in the client’s organization over a period of three weeks to nine months. Each quarter, a number of (disqualified) accounts are replaced with a series of new accounts. Whereas the sales manager calls on a territory or vertical market, the AE is calling on a distinct list of named accounts.
SE – Sales Engineer. This role is one of the key functions in platform sales, where the product has a higher level of complexity. The SE is responsible for the sales support before the client commits, and for the integration of the software within the existing tool stack after the client commits. A highly skilled SE can modify the product to ensure it works within the client’s environment. They are often the most qualified resource on the call, and both the seller and buyer often put a lot of trust in the SE. The SE’s role may expand beyond the commit, meaning that they are responsible for overseeing the implementation of what they recommended.
SA – Solution Architect. Although similar in nature to the SE, the SA is more focused on customizing the product to the client’s needs, and less on integration within their existing infrastructure. For example, the SA will setup the client’s dashboard to their specific needs, whereas the SE ensures the proper usage of APIs. Similar to the sales development roles, title inflation has sometimes faded the lines between SE and SA.
Group 3. Customer Success Roles
ONB – Onboarding Managers. These are specialists who drive initial deployment. Like a sales engineer, they support the initial setup of the customer’s account and support the enablement of key moments at the beginning of the customer journey. This role is critical to ensure the customer sees value early in the partnership, serving to drive adoption and net retention. Typically, a key milestone that the ONB is focused on is when the customer has gone live with their product.
CSM – Customer Success Managers. CSMs proactively drive adoption and net retention. Depending on the company’s maturity, the CSM may be initially responsible for onboarding, quarterly business reviews, support, training, and renewals. Over time as a company grows, a CSM’s role shifts to focus on strategic customer conversations. They typically are not responsible for technical work or support; rather, they build relationships with the customers and ensure the services they need are provided to receive maximum impact.
AM – Account Managers. AMs are typically introduced at the beginning of a customer relationship after the customer has committed to a partnership with your company. They are responsible for the commercial aspects of the relationship and work across customer success teams to identify expansion and other contract opportunities. Companies typically create AM teams to focus on customer expansion, so that sales roles can focus on new acquiring new logos.
Figure 5. Several areas of growth exist for the account manager (from the book The SaaS Sales Method – Sales as a Science)
TAM – Technical Account Managers. A TAM focuses on providing services to the customer such as custom integrations and migrations. They typically have a technical background and/or experience, as well as customer management skills. An increasing number of companies with complex product implementations are recognizing the need for a TAM across customer success teams, while others are hiring TAMs instead of CSMs.
Emerging Roles in Customer Success (not depicted)
There are a variety of new roles emerging in the customer success arena. These roles are not depicted in the above figure, but you may run into them in the field.
CSR – Customer Support Representatives are typically responsible for reactive support. They help customers who identify a software problem or don’t know how to use a particular aspect of the platform. They typically work through a support portal via phone, chat and/or email, and are responsible (often in joint efforts with the training team) to manage the knowledge base. CSRs serve as a liaison between the customer and the product and engineering team to ensure any defect is fixed.
CET – Customer Education & Training is used as a company matures to teach its customers how to use their product, as well as to educate their own team internally. Real-time guidance and learning management systems are typically used for this function.
CX – Customer Experience performs activities to measure and improve a customer’s overall experience. This may include the voice of the customer, health scoring, and managing focused programs such as the Net Promoter Score program.
CEM – Customer Engagement Marketer is an extension of Marketing, but purely focused on driving engagement within existing (rather than new) customers.
STEP 5. GO TO MARKET IN STAGES
GTM models will evolve with their level of role specialization over time, as the company goes through each stage of growth.
GTM Stage 1. Founder sales (getting your first 20-30 paying customers)
Figure 6. Founders (F1 and F2) split the responsibility (from the book How to Get to $10M in ARR)
At the start, the founder(s) is doing sales (F1) and customer success (F2) for the first 20-30 deals. As sales grow to about $10-50K in MRR, one of the first hires is often an AE who immediately manages the inbound and starts planning the outbound. The AE will need in-depth training and hands-on coaching by the founder on existing use cases, the market, and the product, in order to effectively sell.
GTM Stage 2. Getting to $1-2M in ARR
Figure 7. Splitting responsibilities into separate Sales and Customer Success teams.
The organization starts to specialize with roles around $100K in MRR. The AE is now focused only on closing, and you hire an SDR to generate pipeline by qualifying inbound leads and going outbound. You hire a CSM to cover existing customers – primarily to manage issues, but soon your board or advisors are asking for retention and growth metrics, which means the CSM will need to focus more on growth.
GTM Stage 3. Growing the Pipeline
Figure 8. Separation of inbound and outbound can increase velocity
The organization is ramping to an overall $3-4M in ARR, and it now starts to specialize with inbound versus outbound as it begins to run out of leads. SDRs need to develop and work on their own customer outreach, in tandem with marketing campaigns. On the other side of the customer journey, Customer Success starts to become overwhelmed by onboarding requests and isn’t spending enough time helping customers get the most value from the product.
GTM Stage 4. Scaling Growth Through Expansion Sales
Revenue is growing beyond $5-8M in ARR, and the organization starts to specialize by creating separate roles for Onboarding versus Customer Success. The Success team is helping customers use the product and is renewing monthly/annual contracts. But upsell activity is likely lagging – in particular from the big accounts that you had high hopes for – and your net revenue increase barely covers the churn.
Figure 9. The separation of Customer Success roles creates scalability
GTM Stage 5. Diversifying Across Markets & Verticals
You are now growing beyond $5-10M in ARR, and the organization has developed specialized go-to-market strategies based on deal size or vertical markets. We’re using the educational market as an example here: selling to individual schools versus school districts.
Figure 10. The $10M Organization with two go-to-market (GTM) models
GTM Stage 6. Grown-Up with Full Specialization
Figure 11. Specialized organization matching the GTM model to the business model
As you can see in Figure 11, we now have a highly specialized and scalable organization across three different market segments – for example, Enterprise (high ACV), Mid Market (medium ACV) and SMB (low ACV).
STEP 6. KEEP GOING!
We hope this helps you navigate the alphabet soup that the market has created of these roles, and that it provides you with a staged approach on how you can look at your organization. If you would like to keep going, we have a number of resources available for you:
Resource 1: Series of books on a more scientific approach to sales
- Book #1 The SaaS Sales Method – Sales as a Science. Provides the methodology behind SaaS sales and the growth model that fuels it.
- Book #2 Blueprints for a SaaS Sales Organization. Provides insights into a process driven approach to sales.
- Book #3 How To Get To $10M in ARR and Beyond.A scalable growth model is the result of proper design and architecture. This book provides the blueprints for each phase, with best practices from industry experts.
The specialized roles described above each have a textbook aimed at delivering value to the customer. By having your team work on each textbook, they use the same lingo and customer-centric methodology aimed at providing a client with impact, not just usage.
- Textbook Fundamentals – How to Have Customer Conversations
- Textbook Prospecting – How to Prospect for Customers
- Textbook Sales – How to Win Customers
- Textbook Customer Success – How to Grow Customers
Resource 2: A YouTube channel with 100 videos
Those wishing to start right away can find a series of explanatory videos, example role plays, and skill training on our YouTube channel.
Resource 3: Detailed LucidChart templates
There are many common processes that go along with each of these roles. We’ve defined these processes and made them available through LucidChart.
For the past several decades, most companies have used a traditional model typically referred to as the “sales and marketing funnel.” According to this funnel, the marketing function is responsible for generating a certain volume of leads at the top of the funnel, sales development is responsible for qualifying those leads into opportunities, and sales is responsible for converting those opportunities into becoming paying customers. Leads go into the top of the funnel, emerge as paying customers from the bottom of the funnel. This model does apply, but only for companies that earn most of their revenue when the customer makes that initial purchase, such as a one-time hardware purchase.
Why the funnel doesn’t work for a recurring revenue business
But there is a fundamental problem with this model: Recurring Revenue takes place outside the purview of this conventional funnel. Why? Because the funnel ends at the point when the deal converts to a paying customer…which means that the funnel does not show the recurring revenue that takes place in the months and years during which that customer uses the product they purchased, when they renew their contract, and when they expand their usage. In a recurring revenue model, 72 to 93% of the lifetime value that we get from a customer happens after the initial deal.
If you use a recurring revenue model, the funnel only leads us to the halfway point.
And further still, it often leads us to the wrong conclusion, which is the idea that “in order to grow, we need to win more deals…and to win more deals, we need to have more leads.” Many companies then decide to rely on a volume-based strategy as a result: just get more (leads) into the funnel, and more (deals) will come out.
What recurring revenue businesses need instead is a model that covers the entirety of the customer journey. This model needs to account for the actual growth loops that take place in recurring revenue, and account for them in the right place along the customer journey.
For this, companies need to apply The Recurring Revenue Bowtie. The Bowtie is already being used by hundreds of high-growth SaaS and recurring revenue companies. Instead of stopping at the halfway point, it accounts for what happens after the initial deal is made: onboarding, getting to first impact, renewal, and expansion.
Figure 1. The Recurring Revenue Bowtie. The Bowtie and associated frameworks from the Recurring Revenue Operating Model are all available open source, at www.thescienceofrevenue.com
Because of this recurring revenue model, we have to think about the customer buying process much differently than we did in the past.
Figure 2. Figure 2. Visualization of the types of sales methodologies.
Traditional Sales Methodologies
In traditional sales models, the funnel always looked the same but involved a range of different types of sales methodologies: solution selling, consultative selling, and strategic selling.
Solution Selling. The original methodology was called solution selling. A customer comes to your sales team already aware of the problem and the probable solution. The sales rep only has to assist the customer with selecting the right product. This is the shortest of the methodologies, as it involves only the first part of the funnel.
Consultative Selling. This methodology is used when a customer knows that they have a problem, but they need help understanding potential solutions. In this method, the sales rep has to educate the customer on the options as well as help them select the right product. Consultative selling typically focuses on identifying and influencing the company’s key decision maker.
Strategic Selling. The above methodologies worked well until about 2003, when the dot-com bubble burst. Cash-strapped customers suddenly weren’t interested in buying new technology. Sales teams had to get more creative, pushing innovative solutions even if a customer hadn’t identified a specific problem. One of the classic indicators of strategic selling — also known as provocative selling — is an on-site workshop for leaders of a company looking to optimize or overhaul their business. This methodology often requires executives from the seller to reach out to executives from the buyer.
The SaaS Sales Method
The SaaS Sales Method is a modern sales approach, developed to serve the unique needs of the SaaS business model. With a SaaS methodology, profit generation shifts from soon after closing the deal, to months or even years in the future, at the point when the solution provider delivers the impact that the customer was promised. In many cases, persistent use of the service and growth of the account are needed for the SaaS company to achieve profitability on that account.
The SaaS Sales Method involves all customer-facing employees (Marketing, Sales, Customer Success). It emphasizes the importance of discovering, communicating, and delivering business impact consistently across the entire customer journey. In addition to the traditional steps along the funnel — awareness, education, and selection — the SaaS Sales Method adds onboarding, use, and expansion. It looks ahead to the lifetime value of a customer, rather than only what happens before the initial contract is signed.
Marketing and sales have traditionally operated in silos, which resulted in hand-off points where qualification criteria were used. For the SaaS Sales Method to be successful, we have to transition from qualification-driven sales (usually limited to a one-time event) to impact-driven sales (happening anywhere during the relationship with the customer).
Figure 3. The difference in qualification criteria based on budget (one-time) vs. priority (anytime).
Of note here is that the SaaS Sales Method doesn’t replace all the other methodologies; instead it combines and leverages all the previous methodologies. Teams may use a provocative technique for prospecting, a consultative technique for qualification, and a solution-oriented technique for selling. That essentially is what happens today with many high velocity sales organizations.
The Seven Key Moments that Matter
There are a few specific moments in sales that require special attention. If you and your team perform well during these moments, they will work in concert to generate success. We’ve identified seven key moments that are crucial during the SaaS sales cycle.
Business results, not fit. In the SaaS Sales Method, the concept of fit is reframed as impact. For example, the sales team at a car dealership must understand that they are not just selling a car — they are selling the ability for their customers to get to work and to provide for their family. Uber realized that impact could be unbundled from the car itself. Now Uber now sells pure impact (the ability to get around) to its customers, eliminating the need to actually own or even rent a car.
Conversation, not qualification. Instead of determining whether a prospect is “qualified” for your solution, focus on the fundamental skill of conversation. Conversation is a more natural, human activity. It helps you connect with the prospect on an emotional level and uncover real, pressing pain points. Have a clear idea of whether, when, and how your solution can have an impact on the customer’s business.
Figure 4. The difference in qualification criteria based on budget (one-time) vs. priority (anytime).
Diagnosing, not pitching. Keep this in mind: “Prescription before diagnosis is malpractice.” A salesperson must first understand the customer’s pain and what they want to achieve, before recommending a solution that will benefit the customer’s business.
Trading, not negotiating. This single change in wording and emphasis can have one of the greatest effects on your cumulative sales. When two parties negotiate, typically both parties come away with having given up things that they want; both parties walk away with something they were hoping to get, but compromising on other things so that a deal could be struck. That’s not a win-win scenario. Instead of negotiating, think about what you’re doing as trading. For instance, if you’re asking for something of value from the other party, what are you going to offer to them that is of equal value. This mentality forces the seller to think from the customer’s point of view, not just their own.
Orchestrating, not onboarding. Rather than just onboarding the customer to get them to start using the product, consider this to be an opportunity to orchestrate the entire business relationship going forward. Guide how the relationship will develop, set milestones for success, and ensure the relationship is set up to provide real impact to their business.
Results, not usage. Product usage isn’t a proxy for success. You should be looking at the success of the product itself. A more impact-focused approach would be to explore whether the customer is getting the results they need from the product.
Growing, not upselling. “Land and expand” implies that the customer is like a territory that should be mapped, flanked, and conquered. Instead, expansion teams should be thinking about growing the customer relationship. It’s the impact that matters most to the customer.
Every company needs a documented sales process and sales playbook that will evolve as the business grows. There are several basic steps to consider as well as pitfalls to avoid when designing and implementing a process.
Simple Sales Process Design
Different sales teams may use different words to describe the steps in their sales processes, but the generic process shown in Figure 1 below outlines the vast majority of all sales processes that companies might use. This simple design is considered customer-friendly because it describes sales activities from the point of view of a salesperson trying to produce value for the customer rather than a salesperson trying to meet quota.
Figure 1. Standard customer-centric SaaS sales process
In this simple sales process, there are three basic areas of sales activities that you can see:
- Prospecting. Prospecting here includes three sources of opportunities or leads: Outbound, Inbound, and Targeted Accounts. Each of these sources may or may not result in a Sales Qualified Lead (SQL), which is handed off to a sales rep to become a Sales Accepted Lead (SAL), or alternatively, a No Show.
- Sales Process. The sales process labeled above includes the traditional steps of the salesperson’s conversation with the prospective customer – Diagnose, Prescribe, Assist, Recommend, Trade, and Commit – all customer-centric activities which will either result in a Referral, Go Dark, Preboard, or Win.
- Customer Success Process. The beginning of the Customer Success Process is shown here in the Preboard and Onboard steps.
Not every Go-To-Market model will require the same sales process. Depending on your company’s market segment or customer type, there will be slight differences and adjustments that need to be made.
In Table A, you can see how the sales activities vary depending on the target customer involved.
Table A. Applying the sales activities
How to Create a Sales Process and Playbook
A clearly defined sales process and sales playbook is essential no matter what stage of growth a company is in. Success in SaaS sales requires measurement, and that requires the company to be methodical.
Documenting your company’s sales method has three major benefits: First, it provides consistent guidance to sales reps about how to progress through each deal. Second, it conforms company sales activities to a process that you can easily measure. Third, it allows you to understand what is working well and what needs to be adjusted.
To create a sales process and sales playbook for any size company, follow these three basic steps:
Step 1. Determine Which Sales Process: Using Table A, decide which methodology and sales process is best suited for your business and make modifications as needed.
Step 2. Map Out the Stages. Using Table B as a guide, map out the different stages of your sales playbook.
Step 3. Define the Stages. For each stage of your sales process, define the following:
- Goal: A description of what needs to happen during that stage
- Actions: The actions that the sales reps should take at that stage to gain clear insight into the prospect/customer and the situation
- Enable: The enablement tools available to assist the sales process at that stage (documents, references, team members to bring in, etc.)
- Outcome: The single outcome that should result from the actions taken at that stage (often a confirmed meeting with the prospect/customer)
There are different considerations to focus on at each stage of the sales process. The relevant goals, actions, enablement tools, and outcomes for each stage are displayed in Table B below
Table B. A snapshot of a generic SaaS Sales process
The Sales Process and Growth Phases
A sales process should reflect where your business is in terms of growth and maturity. Keep in mind that your process will likely evolve depending on which phase of growth that your business falls into – Start Up, Grow Up, or Scale Up, as defined below.
Use these different phases to help you determine how complex and well-developed your sales process and CRM system should be.
Figure 2. A simple “solution” sales process used as a baseline in the Start Up phase
Phase 1: Start Up
At the Start Up phase, companies are likely to be storing sales activities on a spreadsheet rather than using a CRM. If your company is in this phase, you should start creating your sales process and playbook after closing your first 10 deals. That process and playbook should be updated and refined as you learn more information by navigating and closing more deals – revisit them after 20 deals, 30 deals, 40 deals, and 50 deals. After that, the process and playbook should be stable up to 100 deals.
During this phase, your sales process should have no more than 10 stages. Overengineering it will waste the sales team’s time. Use Figure 2 as a baseline template; it is based on the learnings of hundreds of companies.
Common Pitfalls at the Start Up Stage
Pitfall #1: No sales process. These early-stage companies are usually in Founder Sales mode, so every deal closes differently. While it may be clear to the founder how the process works, others on the team may be uncertain.
Solution: Search company emails and calendars for the customer’s name so that you can review a history of the relationship, how it started, and the meetings you had. Try to glean common themes and language from each deal that the company closes so you can document it.
Pitfall #2: Self-centered sales process. Your sales process feels sales-y (e.g. “Qualify, Demo, Negotiate, etc.). Sales reps that receive this type of guidance will build a company and process that takes more from the customer than it gives, which ultimately results in unhappy customers.
Solution: Look at the key actions in each step of your sales process and ensure they provide value to the customer. For example, the term “Qualifying” is typically more focused on determining the customer’s situation rather than learning about the customer’s true underlying issues or pains. Replace “Qualify” with “Diagnose” and teach your sales team how to diagnose the customer’s pain by asking the right kind of diagnostic questions. Do the same with each step in your sales process to make it more customer-centric.
Pitfall #3: Overly detailed sales process. Over-designing a sales process will kill deals. Not every step and criterion needs to be identified. This will translate into dozens of fields to complete in a CRM. Sales reps will end up spending too much time entering data rather than talking to customers.
Solution: Keep your sales process simple at first. Use the baseline template in Figure 2 and make changes only when you find it necessary.
Figure 3. Scaling up the sales process to become more customer-centric and focused on outbound opportunities
Phase 2: Grow Up
Businesses in the Grow Up phase are usually outgrowing spreadsheets so they will need to implement their first CRM to help with the sales process.
At this point, your CRM can be something simple and relatively inexpensive, like HubSpot, which is free, or ProsperWorks, which is G Suite-based. A more expensive and complex CRM like Salesforce is not typically worth the commitment yet as it requires a significant amount of time and resources (including the help of a Salesforce consulting partner) to get it up and running.
Additionally, the sales process of a Grow Up-phase company is not completely set yet. As you build up your sales team, you will continue to learn more and make changes, so you need flexible, simple tools that are easy to manage. Salesforce is simply too involved at this phase.
These companies should also avoid exporting data from their chosen CRM to a spreadsheet or slide for reporting uses. For both internal meetings with the team and board meetings, simply use your CRM’s reporting functions. While it may take more time to get accustomed to, it lessens last-minute frustrations and errors because the numbers come directly from the source.
The Grow Up phase is the time to start holding your team accountable for executing the sales process, but you still need to be flexible and allow room for change. Review and update your sales process every quarter to make sure it still meets your company’s needs. Use recordings (or calls, demos, etc.) to streamline the process as much as possible.
Common Pitfalls at the Grow Up Stage:
Pitfall #1: Failure to analyze deals against a process. Your company keeps winning deals, but the sales reps do not review the deal to learn why the customer purchased your solution and how to improve the customer experience.
Solution: After a sales rep closes a deal, ensure that they look back over the process at each step to understand what happened, why, how to replicate it, and where there is room for improvement.
Pitfall #2: Expecting a new sales rep to establish your sales process. Your first sales hire will have experience in sales, but he or she may not know how to build a sales process from scratch.
Solution: The founder should understand these limitations and meet with the sales rep to build the process together (using Google Slides, Docs, Sheets, etc.). Because the founder has knowledge of the target customer and the sales rep has knowledge of efficient sales, their two areas of expertise combined will contribute to the creation of a better sales process.
Pitfall #3: Selling to several different types of customers. When your business sells to all types of customers – from individuals to global companies – you run the risk of spreading your resources too thin and doing a mediocre job of serving every customer.
Solution: At this stage, it is important to focus intently on the types of customers that you want to serve. Be purposeful and consistent in determining your target users. This way, you can know and serve a more focused customer segment well.
Pitfall #4: Closing deals but failing to provide post-sale support. Your company is closing deals but it has no way to handle customer needs, issues, or complaints that arise after the sale.
Solution: Customer success post-sale is just as important as the sale itself, if not more so. If the company does not yet have any dedicated Customer Success team members, create a plan with your product/engineering team for how you will address any customer issues that arise after the sale.
Figure 4. Fit and Pain are reversed on inbound vs. outbound processes, resulting in the wrong action
Pitfall #5: Using the wrong sales process. There is a flaw in your process that leads your sales reps to approach prospects in the wrong manner. For example, when a prospect reaches out via your company website, a sales rep immediately responds with a series of actions – call, voicemail, email, etc. (Because time is of the essence, some companies aim to do all of these actions within minutes.) As a result, the prospect feels intimidated by the aggressive follow-up, and the sale becomes more difficult. A map of these actions is displayed in Figure 4.
Solution: Sales reps should learn that all inbound leads (MQLs) are not created equal. This time-sensitive approach is being used in the wrong situation. For instance, if a prospect downloads a detailed research paper from your company website and provides an email address in an online form, the lead may be wrongly categorized as an inbound marketing qualified lead (MQL). When a sales rep immediately and repeatedly contacts that lead, they are acting as if the prospect has already expressed a pain, which is not the case. In this type of situation, this MQL should have been sent into the outbound sales process where research should be done to determine if the prospect actually has a pain that the company can solve. See the differences between true inbound leads and quasi inbound leads in Table C.
Table C. The difference between “true inbound” and “quasi-inbound” leads
Figure 5. This process adds targeted account outreach, which is often associated with provocative selling. In this phase, the sales process now extends to customer success for a full customer-centric relationship with each account.
Phase 3: Scale Up
Once in the Scale Up phase, a company will need to secure its sales process and CRM. This is the time to invest in correctly building out the platform that will be used to scale the business. Metrics should be decided upon and dashboards should be finalized.
You should consider spending between $5,000 and $10,000 to set up the CRM and create dashboards. Before making the purchase, however, discuss with peers in your specific industry or niche market to determine which CRM is best for your business. Upon installation, a CRM consultant will need to understand your sales process, so by this time you should have your sales playbook ready to assist them.
Your business may now be addressing new segments of the market as well. For example, you may have moved from selling only to SMBs to targeting mid-market customers. Each of these new markets should go through the same sales process development steps discussed above, with updates every 10 deals, 20 deals, 30 deals, and so on. Adjust the stages, timing, and tactics at each step so that your company continues to add value for customers throughout its new process.
Common Pitfalls at the Scale Up Stage:
Pitfall #1: Retaining the same sales process. Your company has expanded into different markets, segments, or verticals, but it has kept the same sales process for all of its customers.
Solution: New segments of the market behave differently. If your company used one sales method (such as Consultative) to sell to SMBs, you will likely need to change your process. For example, selling to mid-market customers is different because your sales will now require more people to approve the process, a longer sales cycle, and a more structured purchasing process. To remain customer-centric and continue bringing value, your company must create a sales process that fits each segment of the market that it targets.
Pitfall #2: Setting up the CRM yourself. While you might be capable of setting up a CRM yourself, the margin for error here is great, as are the frustrations of having to redo it later if you make a mistake. This can lead to a lot of wasted time and resources.
Solution: Use a professional CRM consultant. For instance, if you are setting up Salesforce, you should bring in a proven Salesforce consultant to ensure that everything is installed correctly the first time.
Pitfall #3: Using a niche CRM. You attempt to use a lesser known CRM to attain certain benefits like unique customizations, cost savings, etc.
Solution: At this stage, your company should commit to a standardized CRM that provides the best infrastructure for your business. The benefits you receive from installing an easy-to-use CRM that is familiar to sales reps and sales operations teams far outweigh any customizations you might get from a niche CRM.
Jacco J. van der Kooij, Founder Winning by Design, Palo Alto, California
Traditional B2B marketing and sales frameworks such as the sales funnel, lead qualification and sales methodologies do not achieve the desired results in SaaS businesses.
Definition of the Frameworks
A sales methodology describes the process of how to acquire revenue, and a qualification methodology describes what you are going to measure. When you combine lead generation, lead qualification, and customer acquisition processes you get a system. In marketing and sales, this system historically has been referred to as the funnel. Recurring revenue models such as SaaS leverage a client’s success to create compound growth and need their own framework.
SaaS Sales Has Outgrown the Funnel
In 1898, Elias St. Elmo Lewis developed a model that mapped a theoretical customer journey from the moment a brand or product attracted consumer attention to the point of action or purchase. He created a four-stage process Awareness, Interest, Desire, and Action, or AIDA [Ref. 3.]. This term was popularized when enacted in a scene by Alec Baldwin in the movie Glengarry Glen Ross [Ref. 9.]. In the AIDA model, revenue and profits are realized shortly after the client signs on the line which is dotted.
Many sales and marketing organizations still use a derived version of AIDA today: Namely, the marketing and sales funnel. The lines between marketing and sales have blurred over the years, but the funnel and its shape remain the way how we describe and visualize the process. Around 2008, a new business model became popular, in which the upfront purchase and profits were exchanged in return for a recurring revenue stream.
Up to this point, software was sold using three to five-year contracts, measured in hundred thousand to millions of dollars, and often paid upfront.
The recurring counterpart of this model, which we now know as SaaS (Software as a Service), offered the exact same impact at a fraction of the price by replacing the perpetual revenue with a usage, monthly, quarterly or annual revenue. In the years that followed, a refined version of the opportunity stages became the basis of the sales funnel [Ref. 7].
Historically, there has always been a gap between the strategy and sales implementation [Ref. 4], but never more so than with a recurring revenue model. As you can see in Table 1, with the perpetual B2B model, 60% of the total revenue on a deal is secured on the win and the remaining 40%, from automatic upgrade and support renewals in future years. What is more telling is what happens in the recurring B2B model, where only 18% of the revenue is secured on the win.
Table 1. Distribution of revenue across five years of a perpetual sales model
Perpetual | Year 1 | Year 2 | Year 3 | Year 4 | Year 5 | Total | |
Purchase price | $120,000 | $120,000 | |||||
Upgrade & Support | 20% | $24,000 | $24,000 | $24,000 | $24,000 | $24,000 | |
Annual Revenue | $144,000 | $24,000 | $24,000 | $24,000 | $24,000 | $240,000 | |
% of total revenue | 60% | 10% | 10% | 10% | 10% |
Table 2 shows that with a recurring model, 82% of the total revenue of a single deal comes from future revenues. The lion’s share of profit in this recurring B2B model has shifted beyond the original win [Ref. 10]. As a result, recurring sales have outgrown the traditional sales funnel. Businesses that are based on a recurring revenue stream require a new model. This model is referred to as the bowtie model.
Table 2. Distribution of revenue across five years of a recurring sales model
Recurring | Year 1 | Year 2 | Year 3 | Year 4 | Year 5 | Total | |
Annual Price | $24,000 | $24,000 | $25,200 | $26,460 | $27,783 | $29,172 | |
Annual Expansion* | 5% | $1,200 | $1,260 | $1,323 | $1,389 | $1,459 | |
Annual Revenue | $25,200 | $26,460 | $27,783 | $29,172 | $30,631 | $139,246 | |
% of total revenue | 18% | 19% | 20% | 21% | 22% |
*The different models provide a very different growth model. The perpetual model is for low volume/big deals, whereas recurring models grow at an accelerated rate due to its lower price and shorter-term contract.
The Bowtie Model
The origins of the bowtie model lie in the travel industry, where it has been used since its inception in 2009 [Ref. 20.]. In the bowtie model, the knot of the tie is the point at which a ticket purchase is made. To get to this point, the traveler has narrowed down the destination, date and price options, and made a purchase.
What follows is growth from ancillary revenue streams such as seat upgrades, baggage, rental car, and hotel but also credit card fees. Before 2009, there was no model for this, and thus no process to capture the ancillary revenues. Today ancillary revenues from credit card fees alone have become a billion-dollar business, and for many airlines, an important profit center [Ref. 5.].
A similar situation occurs in SaaS subscription businesses. In SaaS, the majority of the profits often occur 12 to 18 months following the original commitment [Ref. 1.]. Similarly, the traditional sales funnel does not model how to capture this future revenue.
If you apply the bowtie model to SaaS, it must cover three critical stages beyond the original commit: The installation stage aimed to achieve first impact; the impact stage where customers achieve the desired impact and the recurrence of the impact; and the activity of growing the business together with your client to expand the impact beyond its original scope.
The last two stages create a loop resulting in a compound growth engine. In comparison, a funnel was designed to achieve linear growth. To achieve compound growth, we differentiate between two different methodologies that are often confused with each other:
- A sales methodology – How to acquire the revenue
- A qualification methodology – What to measure and identify qualified opportunities
Let’s start with explaining what a sales methodology is.
Sales Methodologies Governing B2B Sales
There are a number of B2B sales methodologies that govern B2B sales focusing on acquiring revenue. Mapping each of these methodologies against the bowtie model provides insights into how they differ.
Transactional Sales (TRX): A price/shipment-based sales methodology where the client prefers to have as little human involvement (preferably none) as possible. Think of buying something on Amazon. Price, simplicity, and speed of purchase are key decision factors.
Solution Sales [Ref. 14]: The client understands the problem very well and identified two to three options. The client is looking for a seller to answer a few pointed questions, one of which can be the decisive differences over competitors. When a company invested in a unique feature, feature selling is a must!
Consultative Sales [Ref. 15]: The client realizes they have a problem but does not understand the full impact the problem has on the business. Through a series of diagnostic questions, the seller establishes value across the organization and develops a sense of urgency to free up more budget and/or prioritize the budget.
Strategic Sales [Ref. 16]: Client does not realize they have a problem, and a seller – a true expert in this field – provokes a senior executive by reframing the problem or highlighting an immediate opportunity. The key is to get an executive buy-in early on, and to work with the client to identify the impact it can have on their business.
Account Based Marketing [Ref. 2]: When selling a commonly known solution to a commonly known problem (think of a CRM, ERP or MAS), the seller targets a number of decision-makers, influencers and advocates at hand-picked companies with personalized messages and content through marketing and advertising campaigns. It is key is to be relevant to each individual person.
It is important to realize that none of the aforementioned B2B sales methodologies actually address the compound growth engine which is critical to the growth of recurring revenue businesses. Instead, many revenue leaders maintain a maniacal focus on winning more deals, which ironically prevent them from growing the business at a fast rate.
Over recent years, there is one specific methodology that has actually leveraged the growth engine with great success and benefited from the compound impact it creates:
Product Led Growth [Ref. 12]: This is a B2C like methodology that can be used with a high-quality product and/or service experience in B2B. It encourages customers to contribute to marketing the product by using their own social networks to share and amplify the product. A basic example of this is giving a free month of service to an existing user if two of their friends sign up as well. The Product Led Growth (“PLG”) methodology applies to a business that is based on a high amount of deals per month with a low contract value. Key to this methodology is to have a high-quality product, and it further helps to have a very unique feature. Products such as Slack, Zoom, and recently Superhuman, are experiencing the benefits of this methodology. The downside is that this requires the momentum of 100,000s of users which doesn’t apply to most B2B applications and platforms.
Combining the above best practices, a new methodology can be designed for companies that sell B2B applications and platforms, at a much higher contract value, and are based on a recurring revenue business model.
SaaS Methodology: This methodology applies to B2B applications and platforms where a large percentage of the customer lifetime value is realized after the initial sale [Ref. 10]. This methodology modernizes and extends prior marketing and sales methodologies but does not replace them. It does so by adapting these methodologies to higher velocity sales cycles. The methodology includes the processes for demand generation and prospecting as well as post-sales processes such as customer success and account management. A hallmark of the SaaS methodology is to not only make a customer aware of an innovative way to solve the challenge they are experiencing, but to show the impact of the solution in a way that is coordinated and ongoing.
In recurring business, by definition, if a client churns before a profit is established, a loss is made. This makes calling on the right client extremely important. The process of calling on the right client historically is referred to as qualifying. Next, several qualification methodologies are described and how they differ compared to sales methodologies.
Qualification Methodologies That Govern B2B Sales
Think of a marketing and sales methodology as a treatment prescribed by a doctor. When you have an allergic reaction to poison oak, a doctor may prescribe you with a treatment to take two pills per day, right after a meal, for the next five days. In this example, the qualification methodology would be to establish if a) the treatment will have the desired impact, and b) if your body is able to deal with such a treatment.
The actions taken to qualify will likely include measurement of blood pressure, but also a response to a previous treatment. Today, qualification in the marketing and sales funnel happens mostly in two particular situations: lead qualification, and opportunity qualification.
BANT is one of the most frequently heard qualifications methodologies [Ref. 6]. It was originally developed by sales teams at IBM during the 60s. They used BANT to recognize buyers for their mainframe computers versus those who only wanted to see a demo of these enormous machines. BANT is an acronym for Budget, Authority, Need, and Timeline of the decision. Historically, BANT and other qualification methodologies such as ANUM, which stands for: authority, need, urgency, and money, match up well with the solution sales methodology [Ref 14].
CHAMP and FAINT [Ref. 8] are qualification methodologies that add qualifiers around the ability to identify challenges a client experiences and make it line-up well with the consultative sales methodology [Ref 15].
MEDDIC is perhaps the qualification methodology that is found the most common in recurring revenue businesses is MEDDIC [Ref. 11]. And for good reason, created by Dick Dunkel and Jack Napoli during the 90s, MEDDIC differs in that it adds a qualifier in identifying if an impact can be made on a client’s business.
There is no qualification method that is better or worse; what determines the success of any given qualification methodology is how it is applied. For example, using BANT to qualify a CEO in a provocative first-call is doomed for failure. In a similar vein, peppering a client with a series of questions while they are ready to buy is not going to yield the desired result either. What is missing is a qualification methodology that matches up with the subscription business. In particular:
#1. Does the client have an opportunity that can positively be impacted by the seller?
#2. Can the seller help the client achieve the impact in the timeframe the client needs it?
#3. With reasonable certainty, will the impact for the client result in a profit for the seller?
#4. What’s the growth potential beyond the original impact?
It’s clear to see what ties these four questions together: impact. Impact is the standardized qualifier that matches up with the SaaS methodology. Where recurring revenue is the result of recurring impact for the client.
The Impact Framework
There are two ways that impact is perceived: 1) Rational Impact, which is measurable using facts and figures, and 2) Emotional Impact, which is mostly about feelings and experiences. Research shows that people tend to make an emotional decision then validate that decision with facts and figures [Ref. 18].
Emotional impact benefits an individual first, whereas rational impact benefits a corporation first. For example, if a decision results in one-million-dollar savings per year for a company, it is unlikely that the savings are going to find its way into the pocket of the decision-maker.
However, an automated dashboard will directly reduce headaches for the person manually creating reports every weekend. This means that sellers must not only identify their ideal customer profile, but also the type of impact that is most important to each person they are working with, and customer success must ensure this impact is achieved over time.
Organizations have to extrapolate the impact across all parts of the business using an Impact Framework that acts as a qualification framework across all stages.
Findings
Finding 1. The traditional B2B marketing and sales funnel and its qualification methodologies were built for a perpetual business and do not address the needs of a recurring business model (SaaS).
Finding 2. In SaaS, growth comes from recurring revenue. Recurring revenue is the result of recurring impact the customer experiences and is not the same as recurring usage as commonly measured by sellers.
Finding 3. To help customers accomplish a recurring impact, additional stages must be added to the process. Recommended stages to add are: Achieve Recurring Impact and Growth of Impact. This is depicted with a bowtie.
Finding 4. All customer-facing roles must work of the same uniform methodology across all roles and departments, not one that is dictated by one department or is based on the use of a specific software tool.
Finding 5. Qualification is not something that should happen once but throughout the entire process. The qualification methodology must match the sales methodology. For businesses dependent on recurring revenue, an impact-based framework is recommended.
Suggested Actions
Here are a few suggested steps:
Action 1. Bring together a team of representatives from all customer-facing roles to help identify the Rational and Emotional Impacts
Action 2. For each department, create a plan to qualify based on the impact and what action to take.
Action 3. Create a hand-off process between departments based on Impact
Action 4. Codify the agreed actions for each department into your tool stack.
Action 5. Measure and report the number of new leads generated by existing clients.
References
Ref. 1. 2018 Expansion SaaS Benchmark (slide 30) – By K. Poyar and S. Fanning of Openview Advisors
Ref. 2. Account Based Marketing by Wikipedia
Ref. 3. AIDA Definition by Wikipedia
Ref. 4. Aligning Strategy and Sales: The Choices, Systems and Behaviors that Drive Effective Selling by Frank V. Cespedes via Amazon
Ref. 5. Airlines Make More Money Selling Miles Than Seats, by J. Bachman, June 2017, via Bloomberg
Ref. 6. BANT Opportunity Identification Criteria by IBM
Ref. 7. What is a Sales Funnel? (And How is it Changing?) via The 360 Blog, salesforce.com
Ref. 8. FAINT – The New Definition of a Qualified Prospect by Mike Schultzs, via RAIN Group blog
Ref. 9. Glengarry Glen Ross, An examination of the machinations behind the scenes at a real estate office. Released Oct. 2, 1992 by Newline Cinema
Ref. 10. How Adobe, GoPro, Microsoft, and Gillette Saved Their Businesses Through Subscription Revenue by PriceIntelligently via blogpost
Ref. 11. MEDDIC Definition by SalesMeddic via their website www.salesmeddic.com
Ref. 12. Leading with your product is the most effective GoToMarket Strategy by M. Alon via Slideshare
Ref. 13. Seven Sales Qualification Methodologies by Jeremy Donovan via Slideshare
Ref. 14. Solution Selling Definition and Research by Nadia Landman via blogpost on web-site
Ref. 15. SPIN Selling by Neil Rackham via Amazon
Ref. 16. The Strategic Sales: Taking Control of the Customer Conversation by Matthew Dixon and Brent Adamson via Amazon
Ref. 17. The Power of Habit: Why We Do What We Do In Life and Business by Charles Duhigg via Amazon
Ref. 18. The Power of Persuasion: How We’re Bought and Sold by R. Levine published in 2003 via Amazon
Ref. 19. The SaaS Sales Method: Sales as a Science, by Jacco J. van der Kooij, via Amazon
Ref. 20. Updated Bow Tie and Lead Time Numbers by Martin Collings via Shearwater Blog May 14, 2009
Ref. 21. Why CHAMP is the new BANT. – By InsightSquared, via Blogpost.
Presentation Problems – The Demo Trap
Your customers ask for a demo because they believe that seeing the product will help them make a decision faster than talking to a sales person.
We salespeople like to run demos because obviously our solution is awesome, and the customer will find it irresistible as soon as we show them the good stuff.
But here’s the trap: if I show a generic demo, they may lose interest. But if I start by asking questions to learn what’s relevant, they may feel like I’m withholding something valuable.
Catch 22.
The Best SaaS Sales Technique – Diagnose before prescribing
We all want is to get to yes or no as quickly as possible, but the customer vs. sales approach seem to be polar opposites.
When you’re selling B2B SaaS solutions leveraging a Solution, Consultative, Strategic or a SaaS Sales Methodology, you must align your solution to your customer’s desired business outcome.
If you don’t, customers will churn, and that is expensive.
This is a legacy issue caused from the misuse of sales decks regardless of what they uncovered during the Perfect Discovery Call.
Demos need to be more than a well choreographed pitch. Elon’s Tesla and Steve’s iPhone can get away with it because they are selling direct to consumer through a transactional sales process.
Most sales demos suck because they are treated as a monologue – and it’s the same for every potential customer. The best salespeople use a demo to continue to diagnose through the discovery phase.
The problem: Engagement Gap
We love talking about ourselves – and as Dale Carnegie described in 1936 – the best way to get someone to like you is to ask them about themselves, listen and be responsive to what they say.
As counter-intuitive as it seems – stop talking so much about yourself during a demo. Instead, paint the picture of your solution in your customer’s context based on what they are trying to solve.
When it comes to the demo – salespeople tend to go on autopilot. We become enthusiastic and tend to speak faster because we’ve done this part of the call a thousand times. It’s showtime!
Your customers are engaged when you first pull up a screen or begin to show something. They lean in, they listen and their curiosity is piqued.
Then something happens. Maybe you said something that didn’t resonate, maybe a text/email/slack popped up on their phone. Their attention wanes. That’s natural.
But plowing through your demo showing page after page is not the solution.
Distractions are normal in a technology driven workplace. One example on why we are prone to checking our email during a monologue is that the average speaker communicates 110-150 words per minute – but we can read 200-300 WPM. That means we can comprehend at almost double the rate – so we get bored. Unfortunately, the answer is not to just speak faster.
The best way to increase someone’s engagement is by asking an open-question. When your customer answers a question they need to spend 100% of their brain power – or they will sound distracted.
- Pro-tip – use video. We’re visual beings, and it’s much easier to not get distracted if we have someone to look at!
The solution: We hate being sold to – but we love to buy
Start by summarizing your diagnosis of your customer. Help prioritize the pain they are trying to solve. Then only show them how you can help solve their top priorities.
Your demo can’t sound like a generic pitch. Share a story about someone just like them instead of telling them you can solve their problems.
To influence someone, don’t tell them what to do. Share how someone just like them had the same problem, and how they solved it.
Here is an easy framework on how to give a sales presentation that your customers will love.
Here’s how to structure a memorable demo to drive urgency in the deal.
Step 1: Summarize your diagnosis and prioritize their pain
Most old-school sales tactics started off with setting the stage about ourselves. But customers don’t care about that anymore – the internet is rich with enough information they need to learn about you.
They care about how you can help solve their problems.
Instead of showing the 50 slides of your sales deck starting with your company history and the logo-salad of all your best customers, focus only on the 3 most relevant parts of your solution that will help provide the biggest impact.
Step 2: Set the Stage
Pull up your screen. Make sure it’s clean – no random tabs/notifications or things that could distract your customer. Orient them to what they are seeing – give them a quick lay of the land. If you don’t, they will be trying to absorb everything and will be distracted.
Focus on the key part of the screen you want them to look at.
- Don’t move the cursor all around – you’ll make them feel like a cat watching a red laser
Step 3: Show Your Solution in Your Customer’s Context
When you demo a feature – speak slowly, try to use their language
Before changing the screen, ask a question
- Ask if there is anything they see on the screen they want to click on.
Demos are great for diving deeper – we’re always trying to understand the impact.
- Do you see how what I showed you solve the pain
- What impact would that have on your business
- Can you see yourself (or your team) using this
- Realtors – come home and smell the cookies, drink a glass of wine with the sun setting
Conclusion
Customers won’t remember all the specifics of your solution, but they will remember how you made them feel like you solved their problem, and showed them how.
Help them make the connection that you understand their pain and desired outcome. Your demo is a tool to progress the conversation and go deeper into your diagnosis. After all, the outcome of a demo when executed well should result in the desire of the customer to receive a proposal.
You have helped other customers like them solve that exact same issue. You are an expert.
Why we need it. How to structure it. What actions to take.
Scaling sales does not just happen by hiring more sales people. Over the past years I have seen that to scale a sales organization you need a scalable sales design. In this post I will share insights how to setup a scalable sales design.
The Foundation: A Customer Centric Methodology
First of all, any modern sales organization must be founded on a customer centric methodology. What is that? In short this is an organization where marketing, sales AND customer success work together to help their customers solve their problem, to assist them in the selection, guide them with best practices during purchasing, provide swift onboarding, and share use-cases of other clients to establish ongoing use. Only based on a solid customer centric foundation can a modern sales organization scale.
Elements of a Scalable Sales Organization:
- Process: Build the right process (a series of best practices gained from working with clients, strung together in the right order)
- Tools: Use tools to optimize the process and that act as a force multiplier (efficiency, effectiveness, UI/UX etc.)
- Content: Enable the client with insights such as use-cases, metrics, and so on that can be distributed online
- Skills: Train the team on excelling in online sales skills. The training must be frequently, persistent, and include expert and peer based training
- Organization: Build a modern and agile organization that can scale
And one more key element:
- Data: Develop a data enabled organization, and make metrics driven decisions that use A/B testing.
Why do we need it?
Conventional sales organization design growth around the number of Account Executives needed per month, multiplied by their production in WINs, at a sustainable MRR/WIN to hit the growth target.
MRR per month = Number of AEs x WINs/AE per Month x MRR/WIN
Many sales leaders create spreadsheets that look something like the image below, in which they stack Account Executives (AEs) over twelve months until the growth goal has been met.
Why does AE stacking not work in SaaS sales?
Most subscription sales operates at a much higher velocity vs. conventional B2B sales —say 30 to 90 day sales cycles, and with a much lower annual pricing — usually between $6,000 — $60,000. To grow such a business requires a sustained volume of deals ranging between 10–100s of deals/month.
Compare this to a conventional account executive that wins 1–2 deals per month but at a much higher annual price often ranging between $100k-$1M. In the conventional model production of the AE is the primary contributor to success and thus the above headcount spreadsheet determines the number of AE’s needed. Over time many SaaS B2B organizations adopted this conventional growth model to scale their business as this is how they were taught to scale sales during the era of IT/IS sales.
The challenge with this model is that in subscription sales to generate sales, you need to win deals or rather MRR in volume. And this requires other critical functions— especially in a high velocity environment where AEs are winning deals in 30 days or less.
As many of you know, today we need SDRs to develop 3–4 x the amount of pipeline (SQLs), a marketing team is needed to generate 10–50x the amount of inbound leads (MQLs) for SDRs to convert in pipeline, and Customer Success Manager are needed to onboard the clients and achieve the first value milestone so that customers do not churn before they generate MRR.
As you can see from the distress picture we are running into a scalability problem as the flow is disturbed. To scale the business a design is needed for high velocity/high volume/lower ACV. This design must scale other key functions in relationship to growing the MRR. This is where a sales POD comes in.
To Scale Sales a Scalable Sales Organization is Needed
What is a sales POD
A sales POD combines individuals in different sales functions that are directly dependent on each other but group them together as a team.
This group or POD is focused on making the customer successful from Lead to First Value, and they are often focused on a vertical market/region etc. to be most relevant for their customers. This way the SDRs, AEs and CSMs only need to learn about a subset of use-cases but they get to know these use-cases in a lot more depth. For example selling to MedTech, or EdTech or FinTech.
PODs are metrics driven
The picture below depicts an example of the metrics of a Sales POD structure.
The arrows depict the dependency of the various roles and the flow of the business. In this example: every AE needs ½ a SDR and ½ a CSM so that the POD generates $1.44M in new ARR per year based on the ACV of $120k. Not taking into account churn or up/cross sales.
If I add up the cost of this POD = 2x SDR ($80k*) + 1x AE ($120k*) + 1x CSM ($100k*), I get an idea of the RoI this POD is operating at. In this case:
- ARR (@80%**): 0.8 x 12 months x $10k/month x for the next 12 months = $1.152M
- COST: $80k + 2 x $120k + $100k = $420k
- COST/ARR = 36%
*Bay Area Salaries as of January 2016, **PODs are designed for a 100% but should only operate at 80% capacity
Based on specific business companies may need to add other key functions to this POD such as:
- Web developer/Sales Engineer: Someone who helps with the technical sales, although this is more common in larger SaaS deals
- Demo jockey: A person who does nothing but excel at giving online demonstrations to prospective customers
Scaling Revenue by Scaling PODs
In this case to grow to $30k in MRR you need to have 3 fully ramped PODs.
The above model also depict how to scale the business from an Organizational perspective. As new PODs are launched, top performers from POD 1 will be (promoted) tasked to setup POD #2 and #3. This is a scalable model that allows for rapid scaling. We will address in future episodes how to leverage a POD infrastructure.
A couple of pointers:
- Per @Talha Husayn’s (see comment section), early stage companies can use this model to kick-start. As outlined in the visual below they’d kick-start with 2 SDRs and use 1 AE. As marketing comes on and inbound grows on of the SDR positions promotes (with applicable training please) into an AE position. E.g. the 2:1:1 becomes 1:2:1. From this model you can then grow to a 1:1:1 (Phase 3a) which is more common for larger ACV platform sales that need more depth and involvement from the CSM vs. the 2:3:1 (Phase 3b) which is more applicable for a simpler product such as a chrome extension that has little need for a CSM (may even go 1:3:1).
- Make sure you know how long it takes to ramp a POD to achieve 80% (in days)
- POD structures can differ e.g. operating at a lower cost 2 SDRs/3 AEs / 1 CSM (2:3:1) or higher cost 1 SDR / 1 AE / 1 CSM (1:1:1)
- Use capable leaders to start a new POD regardless of their role. E.g. Not just AEs need to be the POD leader, CSMs and SDRs can also be used to start a new POD as long as they have leadership potential/experience
- Involve POD members in the hiring of new team members and firing of non performing members
- Don’t just assign PODs to dedicated zip codes for an entire year. Instead follow your business – assign PODs to vertical markets month by month as the business dictates.
Learn more
Harvard Business Review recently did an article on a related topic, indicating the importance of the sales process over hiring star sales people. You can read more about it by following the link below: Hiring Star Sales People Isn’t The Best Way To Grow Sales.
Next steps
If you want to get involved we frequently offer Sales Design workshops at Storm Ventures where these and many other best practices of building a scalable sales organization are shared. Since these events are local we have captured the key concepts in videos -you can find them at the Storm Sales Mentorship portal