MEDDIC has long been one of the most effective sales methodologies used in enterprise sales. In the years since MEDDIC was originally developed, the focus of sales has shifted to the idea that recurring revenue happens after you close a deal. And while MEDDIC works quite well for a seller-centric sales motion that primarily focuses on closing deals, it provides less guidance for what happens after the deal is closed (Figure 1). Recent updates with derivatives such as ‘MEDDPIC’ (Paperwork) and ‘MEDDICC’ (Competition) add an even greater focus on closing. This extreme focus on closing causes challenges when applied to a recurring revenue business, such as SaaS.
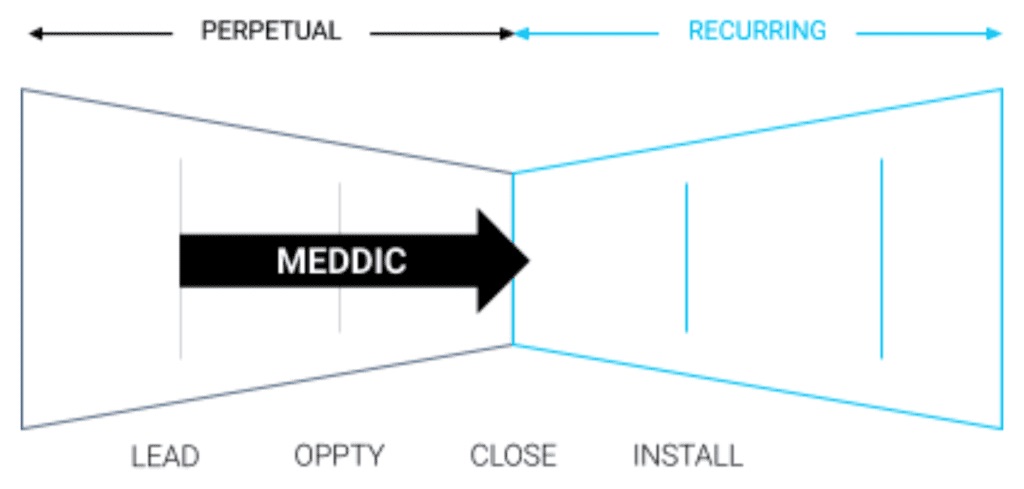
Figure 1. The application of MEDDIC in Enterprise Sales
In SaaS, the revenue is not paid up front, but spread over months or years. It is quite common for a profit to be realized 9 to 18 months (Ref. 2.) after the client makes a commitment. Any time after committing, if the client does not experience the impact they are looking for, they can and will cancel. So to earn a profit, you need a recurring revenue stream — and to earn that, you need to provide the recurring impact a client wants. The focus on “closing a deal” not only increases the churn — it increases the losses.
This demonstrates that we need to think differently here, that we need to treat a SaaS deal different from a perpetual one. Here are a few considerations:
- Recurring revenue is the result of recurring impact: Gaining commitment from the right clients means that you first must understand the impact that clients are seeking.
- Priority, not budget: SaaS clients buy dozens of SaaS products, and their decision is not based on “Do we have a budget?” but rather, “Is this a priority?” So you must understand if the impact you can deliver matches up to your client’s priorities.
- Company wide, not just the sales team: In SaaS, all departments (whether they realize this or not) are connected through the concept of Impact: Marketing raises awareness of the impact you can provide, the Sales team qualifies prospects based on the ability to deliver impact, and Customer Success is responsible for helping customers realize the impact that you have promised.
- The risk is no longer on just the buyer: With perpetual sales such as hardware, the risk mainly lies with the buyer; no seller will be fired for selling too much. However in SaaS, similar to a rental car company leasing out a car, the seller also faces certain risks, because the buyer will cancel if they do not realize the recurring impact they are expecting.
To fill this gap, consider SPICED — a customer-centric diagnostic framework that focuses on delivering the customer’s desired impact, on a recurring basis. The methodology is based on the fundamental principle that recurring revenue comes from recurring impact (Figure 2). By using SPICED and MEDDIC in combination, a SaaS revenue team can apply these methods together to successfully drive recurring revenue.

Figure 2. The application of a methodology to apply to Recurring Revenue
Many SaaS companies using methodologies designed for perpetual licenses (Ref. 3, 4, 5, 6) are starting to see their conversion rates decline, and this is because their sales teams are not well equipped with a sales process that matches with the actual journey that a SaaS customer takes. By focusing their process only on closing the deal, those companies are preventing their Go To Market teams from providing the true impact to customers of which they are capable.
We have created a methodology specific to a recurring revenue business, in order to address the full customer journey. This methodology is called SPICED. You can see in Figure 3 that MEDD(P)ICC focuses on the criteria that the seller needs to close the deal, while SPICED is a customer centric methodology that focuses on helping the customer realize the impact they are seeking.
How to Make MEDDIC Work in a SaaS Model
MEDDIC can be applied quite effectively in a Software as a Service (SaaS) sales model, by combining it with the SPICED diagnostic framework. Consider the following tips to implement the MEDDIC framework in your SaaS sales process:
Qualification vs. Sales Methodologies
A sales process is a series of actions you must take in the correct sequence to achieve results. To give a customer an outstanding experience, place your actions into stages. Each stage includes a series of actions you will perform in the correct order. A proper sales methodology typically includes the following approximate stages:
- Identify
- Diagnose
- Assist
- Navigate
- Recommend
- Trade
- Commit
Typical lead qualification methodologies are based on the idea that qualification only needs to occur as a one-time event. However, the MEDDIC framework is a deal qualification methodology that operates on the idea that qualification should be performed consistently across every stage and action of the sales process.
Sales methodologies are meant to enable the buying experience that we create for customers. But if one methodology focuses on lead qualification, one focuses on deal qualification, and another focuses on deal closing — then this means that a revenue team would need to combine several methodologies at once, which can be quite challenging. It also ends up with different groups within the the same revenue team speaking different languages: for instance, the SDRs qualify using BANT, the AEs use the MEDDIC methodology, and Marketing uses the AIDA framework.
SPICED vs. MEDDIC
MEDDIC is historically based on the idea that growth comes from closing more new logos, which is of course true and cannot be ignored. However, this approach considers anything that happens after the deal is closed to be a much less important.
An alternative first principle that must be applied for a SaaS business is that recurring revenue leads to recurring impact. This means that helping the customer achieve their desired impact motivates them to continue buying more. If you continuously provide value to customers, they will keep buying from you. Because this method is impact-centric, it is automatically customer-centric. The more impact a customer receives, the more they continue to buy over time, and the more revenue is generated as a result.
SPICED is a diagnostic framework that allows for a uniform customer-centric approach, facilitating handoffs, and providing a consistent, high-quality experience for the customer. SPICED can help any AE, SDR, or CSM provide more impact to their customers by applying the diagnostic framework, which includes the following:
- Situation: Background facts or circumstances relevant to the customer’s world. These describe objective factors that determine whether the customer falls within your ideal customer profile and what is happening in their world. Factors such as size of company, number of employees, software they use, hiring needs, security needs, or revenue goals.
- Pain: The problems the customer has purchased your product or solution to help solve. This could include the need to conduct training or recruit, support a global team, pass a security audit, or stop errors to happen in a process.
- Impact: The results produced by solving pain. These are the outcomes the customer is trying to achieve by purchasing your solution. Impact can be both emotional (for individuals) and rational (for companies).
- Critical Event: Any particular deadline by which to the customer must achieve the desired impact or suffer negative consequences. Critical Events drive the customer’s timeline for a purchase.
- Decision Criteria: The people involved in the decision, the process they will follow to reach that decision, and the criteria they will use to evaluate the right solution.
The key difference between SPICED and MEDDIC is each framework’s focus and origins. MEDDIC originates from perpetual software sales and focuses heavily on the decision stage of the sales process. SPICED is based on recurring revenue, so it focuses on achieving continual recurring impact.
And yes, SPICED and MEDDIC can operate in the same world and work together. Let’s examine MEDDIC to see how this can occur…
MEDDIC (Ref. 7) consists of the following factors:
- Metrics
- Economic buyer
- Decision criteria
- Decision process
- Identifying pain
- Champion
MEDDIC is based on the concept that if you take the right actions, the desired results will automatically follow. It requires inspecting the actions of sales teams to ensure they take the right steps, rather than simply expecting them to achieve results. MEDDIC operates in the following ways:
- Functions as a common language
- Allows you to achieve adoption through engagement
- Manages activity instead of results
- Examines the deal primarily from the seller’s point of view rather than the customer’s point of view
MEDDIC focuses primarily on closing the deal; while winning the deal is an element of growth, it cannot increase growth on its own. Rather, growth increases when you sell based on impact. This means that SaaS revenue leaders need to measure impact-based metrics; the savvy SaaS revenue leader knows that it’s crucial to close the right deals and gain the customers who will stay with you long-term, so you can continue impacting them positively over time.
Application of SPICED for MEDDIC Alumni
If you are a MEDDIC alumni, applying the SPICED framework is easier than you might think. There are two key areas that must be supplemented: Impact and Decision Criteria.
How to sell on Impact
To make MEDDIC compliant with a recurring revenue business, you have to understand that MEDDIC looks at metrics with a focus on growing revenue and reducing costs. It highlights the importance of an economic, or rational, impact that a solution provides to a customer.
A rational impact is quantitative and measurable. However, experts have also discovered the importance of emotional impact. Emotional impact is qualitative, based on how a product or service makes customers feel.
MEDDIC directs sellers to focus only on rational impact, while SPICED looks at both rational and emotional impact. You can apply the emotional impact to MEDDIC, as long as you identify it. This guideline typically helps: a rational impact is typically the same or similar across all people involved in a decision, but an emotional impact varies by person.
QUOTE: A rational impact is typically the same or similar across all people involved in a decision, but an emotional impact varies by person.
In the MEDDIC framework, you can identify the emotional impact by identifying pain points. Then, when you move to the decision process, you can sell the emotional impact to the champion, and then provide them with the rational impact to take back to their boss or company.
Influencing the Decision Criteria
The decision criteria in the MEDDIC framework are based on priority. You must determine what the customer’s priority is so they can compare factors and rationalize their decision. This way, you can show the customer how your product or service surpasses what competitors can offer. Apply the MEDDIC framework by translating the decision criteria into impact in the following ways:
- De-prioritize: Clarify with the customer that the price has a relatively small negative impact on their budget, relative to the increase in revenue or productivity that they will see as a result. This will help them understand that price is actually the least important factor.
- Prioritize: Introduce a new element, such as adding a new criterion or pointing out the ability to unlock a new revenue stream.
- Re-prioritize: Educate the buyer by sharing current customer success stories or introducing them to a current customer.
Applying SPICED to Customer Success
The SPICED framework can be used across all stages of the sales process. For instance, during the handoff of an account from Sales to Customer Success, a strong focus (see ‘TRANSFER CRITICAL ACCOUNT INFO’ below) must be placed on reestablishing the impact that the customer is looking for (Figure 4).
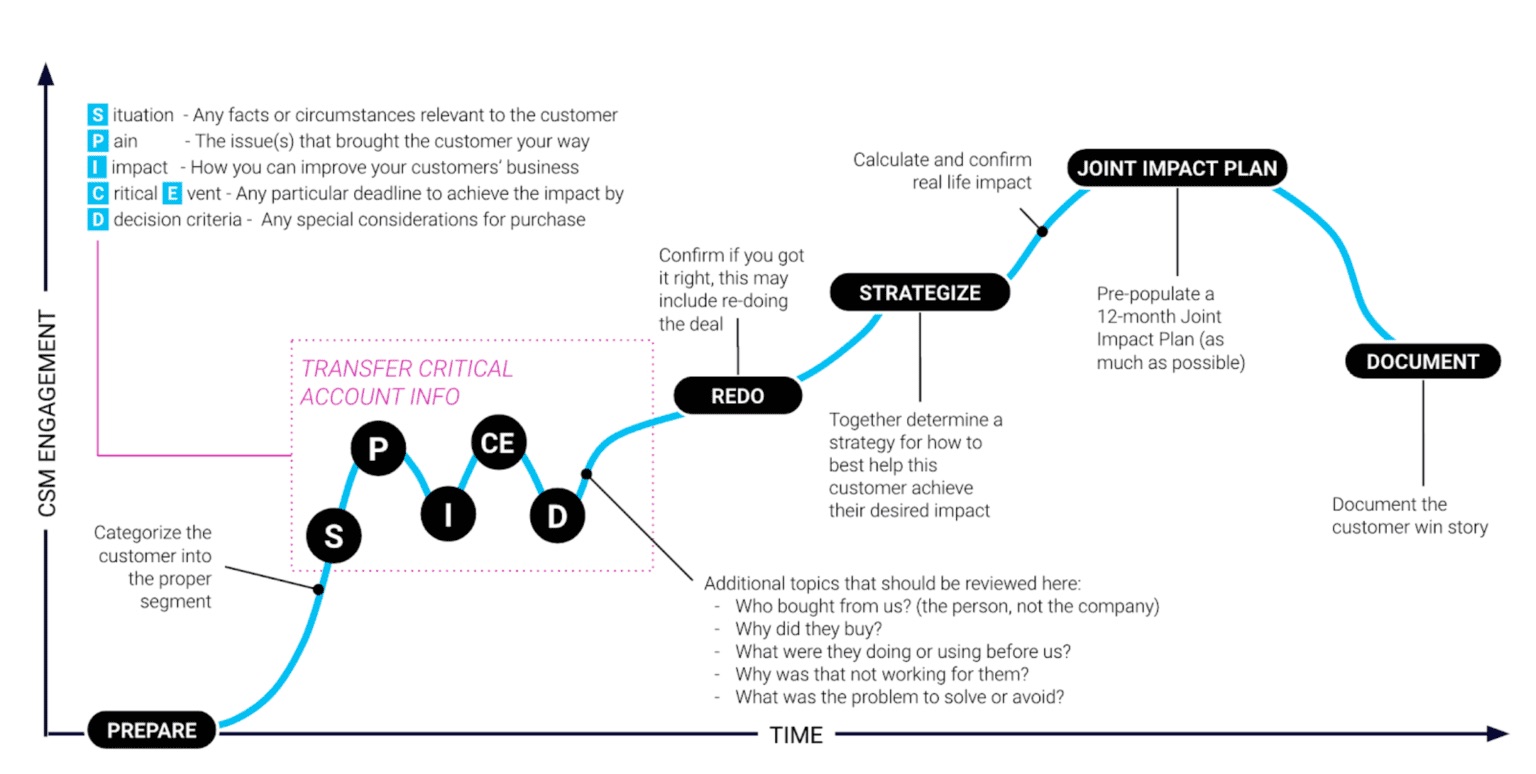
Figure 4. The use of SPICED in the hand-off between Sales and Customer Success
References
Ref. 1. 2018 Expansion SaaS Benchmark (slide 30) – By K. Poyar and S. Fanning of Openview Advisors
Ref. 2. The SaaS Sales Method: Sales as a Science, by Jacco J. van der Kooij, via Amazon
Ref. 3. Seven Sales Qualification Methodologies by Jeremy Donovan via Slideshare
Ref. 4. Solution Selling Definition and Research by Nadia Landman via blogpost on web-site
Ref. 5. SPIN Selling by Neil Rackham via Amazon
Ref. 6. The Challenger Sales: Taking Control of the Customer Conversation by Matthew Dixon and Brent Adamson via Amazon
Ref. 7. MEDDIC Definition by SalesMeddic