An Introduction to Sustainable SaaS Sales Growth
READ TIME: 6-8 MINUTES
Every part of a SaaS sales organization and its sales approach should be structured properly in order to effectively capture growth. The ability of an organization to achieve a higher growth rate largely depends on its ability to accelerate at optimal times during three key stages of the company.
Traditional Sales Growth vs. SaaS Sales Growth
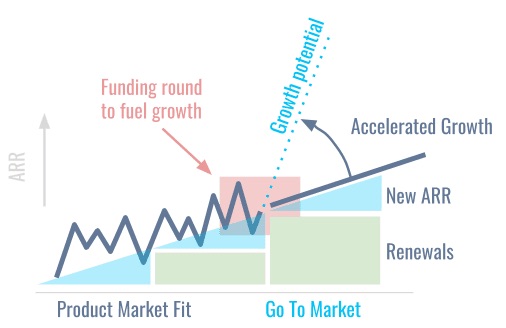
Historically, businesses measured sales growth based on revenue, starting at $0M on Day 1 of Year 1. To double their revenue in Year 2, it was expected that the business would be need to hire twice as many people. In a SaaS model, an example customer acquisition team could grow revenue to $1M in Year 1. If that same team, with no new hires, continues performing at the same level of growth while recurring revenue from renewals also comes in at 100%, it can realistically achieve $2M in Year 2, as shown in Figure 1.
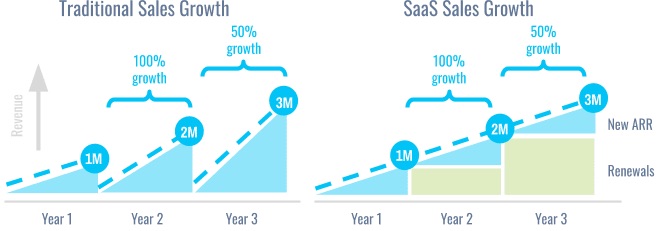
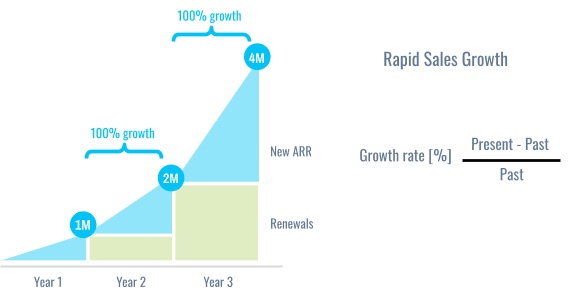
But when a sales team acquires the same amount of revenue year after year, growth rate decreases, as you can see in both traditional and SaaS sales teams in Figure 1. In order for a business to continue growing at the same growth rate, it will require significant investment in customer acquisition efforts to gain new annual recurring revenue (ARR), as depicted in Figure 2 below.
Factors that Affect SaaS Growth
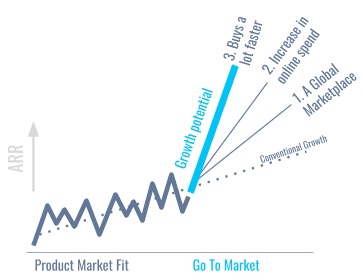
In the B2B software industry, businesses selling products using a SaaS (or OPEX) model will experience exponential growth due to the following factors:
Increase in Online Spend: B2B customers are increasing their online spend, no longer requiring in-person meetings for such purchases. Services have matured to a point where buyers are relatively comfortable spending 20x on services online. For example, buyers who previously spent $1,000 when buying a SaaS services will now spend $20,000 online. [Ref. 1]
Increase in Market Size: Every seller now operates in a global marketplace with 10x more buyers. These same buyers are more accustomed to buying from remote providers. [Ref. 2]
Compressed Sales Cycle: Today’s B2B customers buy much faster than ever before. They shop for a solution to an immediate problem rather than a solution they will implement 12 to 18 months from today. [Ref. 3]
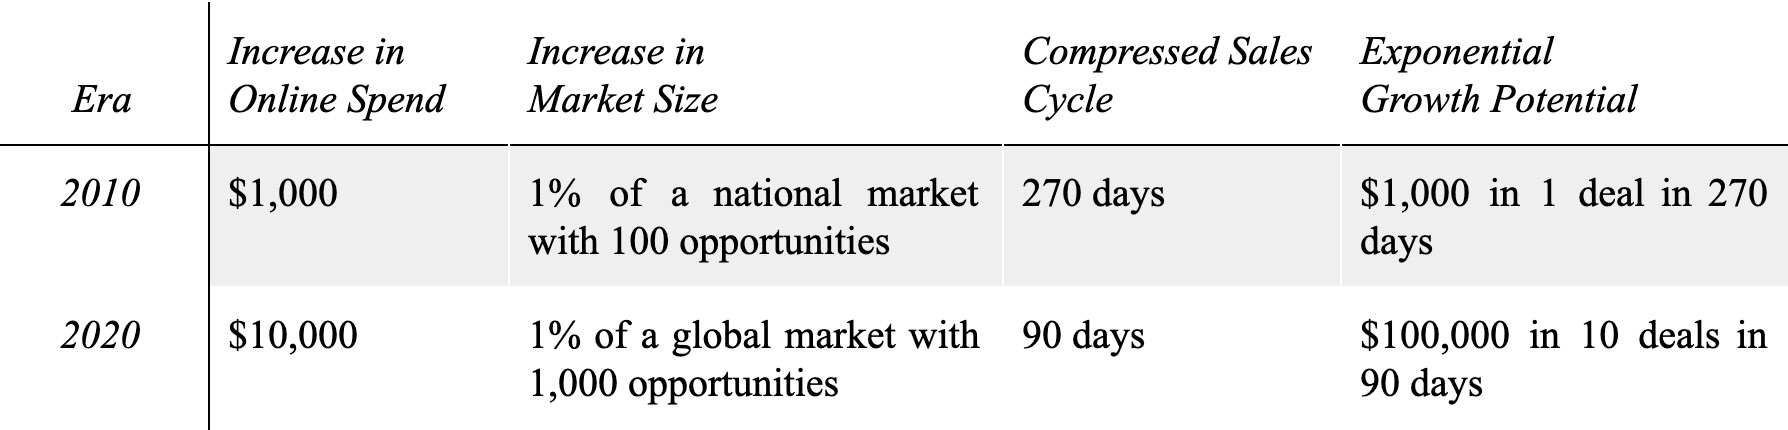
The effect of each of these factors on a SaaS company’s growth potential is shown in Figure 3. Sample figures from the years 2010 and 2020 are also provided in Table 1 to demonstrate how these factors – an increase in online spend, an increase in market size, and a compressed sales cycle – directly affect a company’s exponential growth potential.
The Optimal Time to Accelerate
“Growth hacking,” or the process of taking shortcuts, has become a trend in recent years. One of the popular growth hacking shortcuts was the use of automated forms of outreach to identify leads that want to have a meeting, and ultimately, using low-cost sales resources to run those meetings in an effort to close. [Ref. 4]
Originally, this method worked well, particularly in the years following 2008 when a SaaS solution and its OPEX offering stood out from conventional CAPEX solutions. For example, consider Salesforce’s cloud CRM vs. SAP and Oracle’s on-site/perpetual license model.
Today, however, everyone offers a SaaS/OPEX solution, and growth hacking no longer provides the desired results.
Aside from these types of shortcuts, SaaS companies can achieve rapid growth in several proven ways. Specifically, there are three key stages at the beginning of a company’s lifespan that will have a critical effect on the company’s ability to reach its growth potential [Ref. 5]. Each stage is detailed in Table 2.
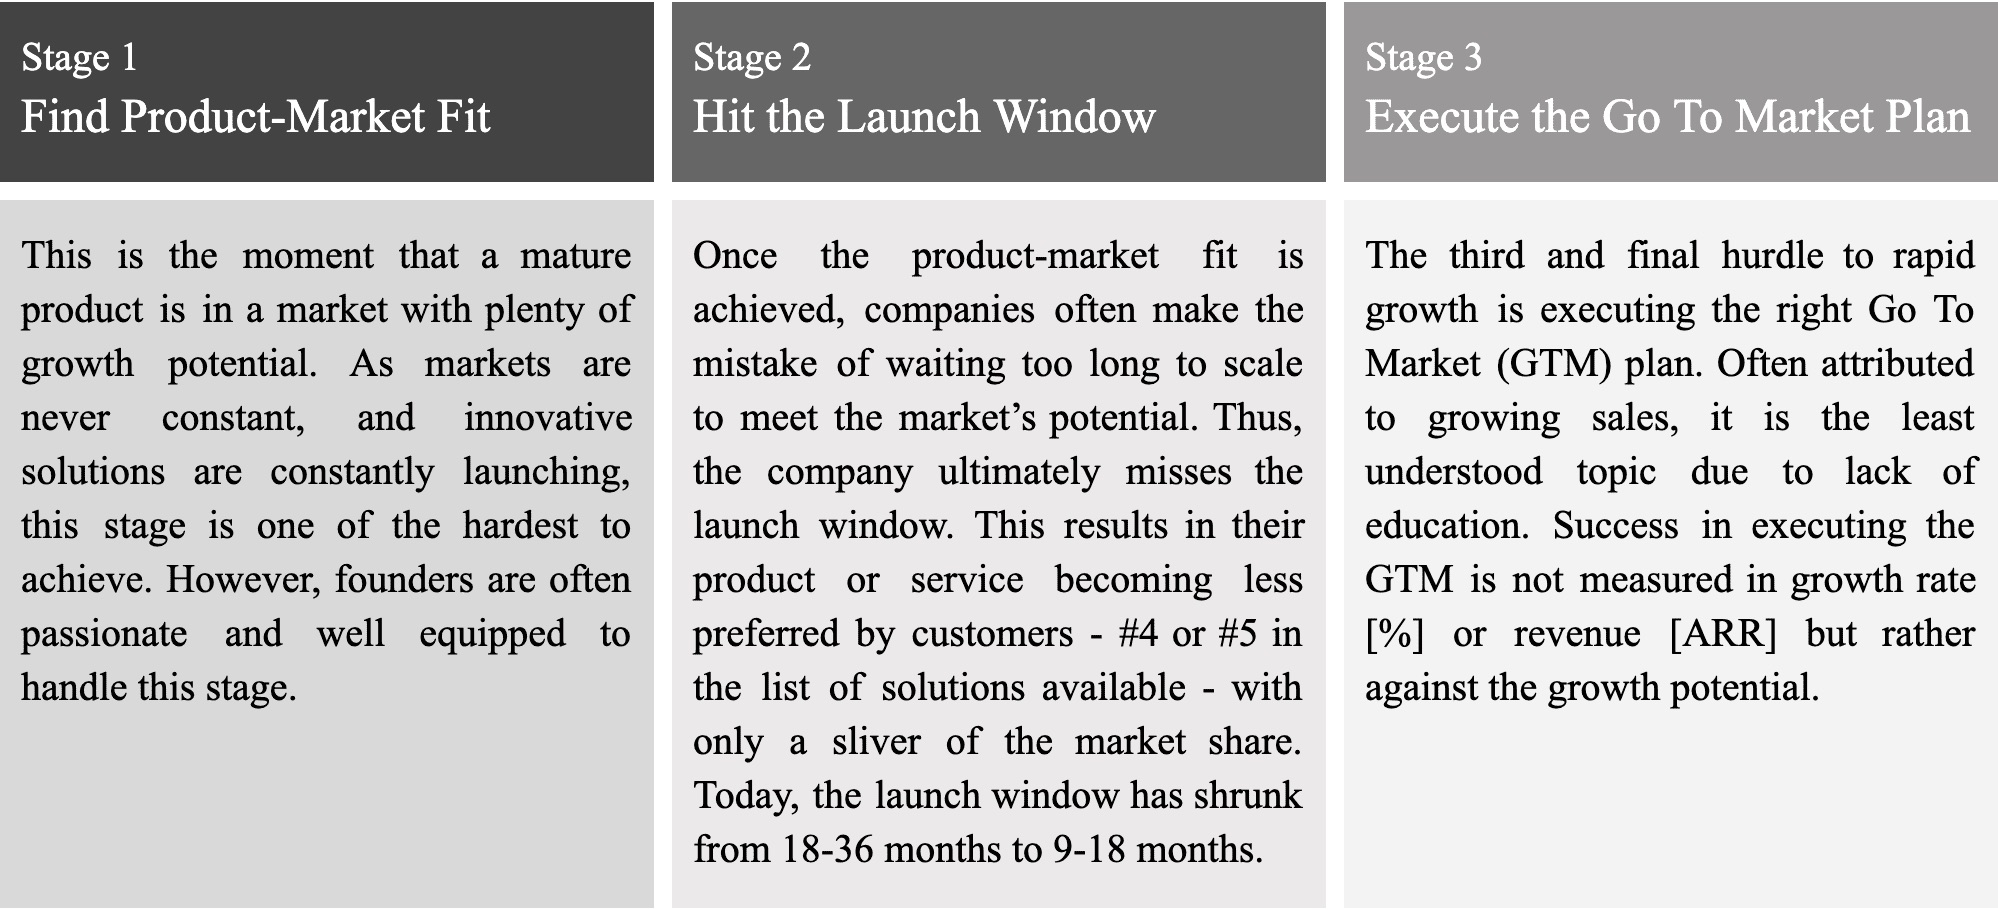
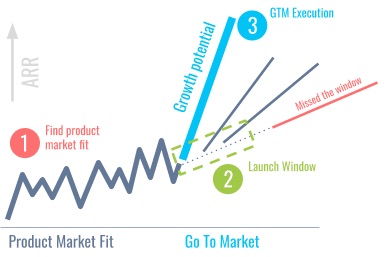
Stage 1: Find Product-Market Fit
One of the keys to growth in today’s SaaS business model is identifying the most effective and efficient Go to Market (GTM) model using a variety of sales and marketing channels.
The challenge here is that organizations are primarily focusing on the results rather than utilizing metrics to measure the effectiveness and efficiency of each GTM strategy. However, those measurements are essential to scaling the business.
Keys to growth that must be identified during Stage 1 of Finding Product-Market Fit:
- WHAT is the value proposition that prioritizes the solution offered?
- WHO is the audience that has a real problem and is willing to take action?
- HOW will the company reach the audience with the real problem in an efficient and effective way?
Due to a lack of measuring effectiveness and efficiency, failures in Stage 1 are amplified by 10x. [Ref. 6] This means there is no real growth, which results in a lower valuation of the company and often the firing of the sales leadership. If there is a replacement sales leader, he or she will lack context for the growth hacking results/failures and instead blame those negative results on poor sales execution by the sales team. The sales leader will likely begin to hire new people and thus continue the downward trend.
CASE IN POINT: Many SaaS companies can demonstrate the ability to get to $1M in ARR by pursuing 10,000 prospects with the “hack” of high frequency email chains to set up demos. However, as these companies quadruple their sales teams, they scale failure. As an analogy, this is like tuna fishing with a fishing trawler using fine nets that destroy an entire ecosystem to catch a single tuna.
Stage 2. Hit the Launch Window
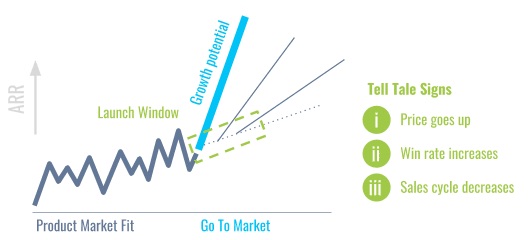
For most companies, there are three telltale signs that they have reached the launch window [Ref. 7]:
Increase in Price: Instead of $24,000 in ARR, the business starts winning clients at $48,000 ARR. This is indicative that its product/service offers real value and customers are starting to understand the impact of the value on their businesses.
Increase in Win Rate: Win rate is defined as the number of sales qualified leads (SQL) needed to win one deal. Instead of winning 1 out of 4.8 deals, the sales team now wins 1 out of 3 deals. This is indicative of a stronger position in the market.
Decrease in Sales Cycle: The Sales cycle is measured as the time between between the SQL and Win stages. For example, the average sales cycle is now 71 days instead of 84 days. This indicates that customers are prioritizing the company’s solution.
What do these telltale signs have in common? They are objective, data-driven indicators that businesses can measure, and when interpreted correctly, they can be leveraged to make a well-informed, data-driven decision.
CASE IN POINT: Common mistakes that can lead businesses to believe they are in the launch window:
- Not distinguishing outliers: Business X showed a single $200,000 annual contract (ACV) Enterprise deal with a 270-day sales cycle alongside dozens of $12,000 ACV deals with 28-day sales cycles. Such a deal will offset all other deals.
- Not entering the data correctly: An untrained sales manager gets a lead (SQL) and, following a discovery call, disqualifies it. Two months later, the same lead re-enters, a new opportunity is created, and the deal closes in a matter of weeks. The lead now is categorized as having a short sales cycle because its full history was never taken into account.
Both examples indicate that businesses must a) segment their data, and b) ensure correct data entry.
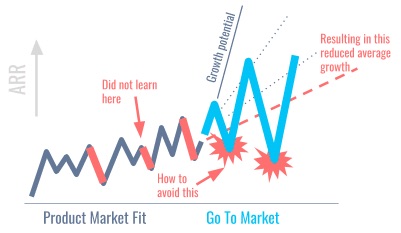
Stage 3. Execute the Go To Market Plan
To meet growth potential, a Go To Market (GTM) plan is imperative. The most common GTM plan is, “To achieve $30M, do 3x the actions that got the company to $10M.” But as evidenced by Figure 8, even when a business grows its sales team by 3x and they perform admirably, scaling to full growth potential still remains a challenge.
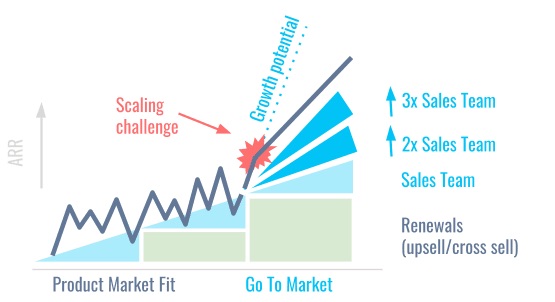
This problem is most commonly experienced by companies who depend primarily on an “outbound” approach. Despite their efforts, they learn that tripling the sales team and tripling the sales activities will not triple the results.
Instead, they require a more modern GTM model that takes into account different layers of revenue.
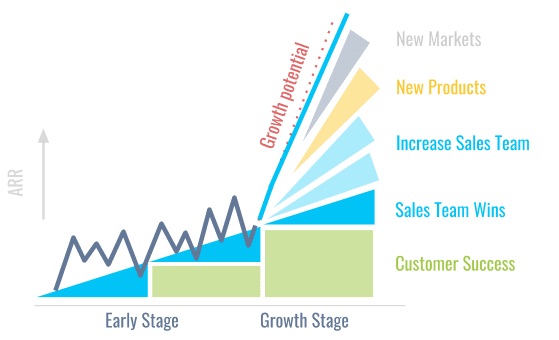
To avoid a scaling problem, think of a business’s revenue as if it has layers.
For example, the following are actions that would create a more modern GTM model for achieving growth potential:
- Add regional teams to increase coverage and decrease dependence on the local market.
- Add new products/services to increase the price and create upsell or cross-sell opportunities.
- Pursue new accounts (for example, switching focus from SMB to Mid-Market to Enterprise).
- Add a strategic partnership that opens a new segment of the market (for example, Healthcare, Government, Retail, etc).
Pursuing bigger deals does not simply mean providing the best salespeople with a list of bigger companies. It requires that businesses segment the market and then develop a new GTM plan for that market.
See here for instances of layering revenue to achieve growth potential. Keep in mind that each layer may need a different GTM strategy.

Talk with a GTM expert about your growth
We’ll help you understand what’s blocking predictable revenue and recommend the best path forward for your team.
-
Get clarity on the root causes slowing your growth
-
Understand which GTM improvements will deliver the biggest impact
-
Explore pricing, timelines, and the right engagement for your goals