Bowtie
Data Model
ONE DATA SYSTEM APPLIED ACROSS THE CUSTOMER JOURNEY
Data Model
Marketing, sales, and finance measure the same customer journey in different ways. The Bowtie Data Model brings those numbers into one system. It maps every metric to the Bowtie, our model of the full revenue lifecycle from first touch through expansion, so every team works from the same definitions. You leave with one source of truth your leaders can trust and your teams can run.
Trusted by 1,000+ Companies Just Like Yours










When every team measures growth differently, no one can steer it
One team’s number does not match another’s. Then the dashboards multiply. Then the forecast stops holding. Each is a sign that the business is measuring growth without a shared model.

Every team reports a different number
Marketing counts leads. Sales counts pipeline. Finance counts revenue. Nobody agrees on the definitions, so leadership meetings turn into debates about whose data is right instead of what to do next.

Dashboards multiply, clarity doesn’t
Every tool adds another view. More dashboards, less insight. You can see activity everywhere and progress nowhere, and you still can’t point to where growth actually leaks.

Forecasts feel like guesses
Without consistent lifecycle metrics, you can’t tell where the engine is strong or weak. Every forecast becomes a negotiation, and no one can say with confidence how mature the GTM system really is.
See the whole revenue engine, measured one way
The Bowtie Data Model maps your metrics to the Bowtie, our model of the full revenue lifecycle from first touch through retention and expansion. Marketing, sales, finance, and customer success work from the same definitions. One journey. One set of metrics. One source of truth.
When the data is shared, the conversation changes. Leaders stop debating whose number is right and start deciding what to do next. You see where the engine compounds and where it leaks. Forecasts rest on defined metrics instead of instinct, and you can finally measure how mature the system really is.
What You Get with the
Bowtie Data Model
What’s included:
→ A complete set of defined Bowtie metrics
One clear definition for every stage of the revenue lifecycle, mapped to the systems and fields you already use, covering time, conversion, and volume across the full journey.
→ Your baseline, calculated
We calculate your current metrics from your CRM, marketing, finance, and customer success data, so you see exactly where the engine stands today.
→ Cross-functional alignment
A working session that gets marketing, sales, finance, and CS to adopt the same definitions as the single source of truth.
→ Installation guidance for your stack
Clear specifications and best practices to stand the metrics up in your CRM, dashboards, and BI, with WbD-certified technology partners available where you want implementation help.
Bowtie Data Model
Turn scattered metrics into one trusted source of truth. Define, calculate, and align your full set of Bowtie metrics across the revenue lifecycle, so every team measures growth the same way and leaders forecast with confidence.

See What Bowtie Data Model Design Delivers
INSIDE THE DESIGN
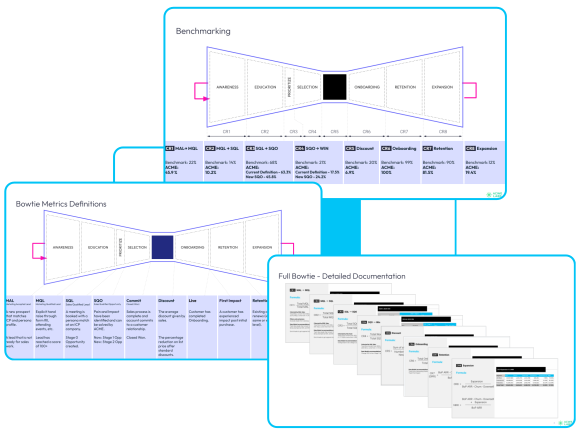
The Bowtie maps the full customer lifecycle, from first touch through retention and expansion. The Bowtie Data Model puts your metrics on it. Time metrics show how fast customers move. Conversion metrics show where they advance. Volume metrics show how many make it through each stage. Together they turn a scattered set of dashboards into one clear view of how your revenue engine actually behaves.
Bowtie Overview
The Bowtie provides a single view of acquisition, retention, and expansion—so teams share one language, measure what matters, and build a consistent customer journey that compounds over time.
We’ve created a dedicated page to help GTM leaders and professionals understand the Bowtie framework.

The Science of Revenue, Proven in Practice
Our frameworks drive repeatable results across sales, success, and revenue operations—validated through customer performance data and real-world outcomes.

Decrease in length of sales cycle

Increase in wins
Increase in ARR year over year

Increase in outbound pipeline share
Your Path to One Source of Truth
Work with the Experts Who Have
Built Revenue Data Systems




Built for the Leaders Accountable for Data-Driven Execution
For Rev Ops / GTM Ops
You own the data everyone argues about. When definitions live in different tools and no two teams count the same way, you spend your time reconciling numbers instead of improving the system.
- Establish one set of metric definitions across marketing, sales, finance, and CS
- Map every Bowtie metric to the systems and fields you already run
- Replace conflicting dashboards with a single source of truth
- Set minimum reporting standards that hold as the business scales
- Move from reconciling numbers to owning the system that produces them

For CROs
You own the number, but the metrics behind it come from teams that each measure differently.
- See conversion, velocity, and volume across the full lifecycle in one model
- Base forecasts on defined metrics instead of instinct
- Pinpoint where the engine compounds and where it leaks
- Give sales, success, and ops one shared definition of performance
- Steer the number with a system you can trust

For CFOs
You are accountable for growth efficiency, but the inputs arrive inconsistent and late.
- Ground forecasts in consistent, defined revenue metrics
- See where capital and headcount drive returns versus waste
- Bring finance data into the same model as marketing, sales, and CS
- Assess GTM maturity with evidence instead of opinion
- Approve scale decisions with confidence in the underlying numbers

For CEOs
You are accountable for growth, but often without a single, shared view of how it happens across the business.
- Gain a system-level view of how revenue is generated end to end
- Replace debates over whose number is right with one shared model
- Give the board and investors a growth narrative built on defined metrics
- See where growth compounds before committing major capital
- Lead from one source of truth instead of competing reports

For CMO
You are measured on pipeline impact, but marketing’s numbers rarely connect cleanly to what happens downstream.
- Connect awareness and pipeline metrics to the full revenue lifecycle
- Define lead and conversion quality the same way sales and CS do
- Show marketing’s impact in metrics the whole business trusts
- Align handoffs on shared definitions, not separate dashboards
- Tie marketing investment to how growth actually compounds

Trusted by Leading Revenue Teams


Frequently Asked Questions
What is the Bowtie Data Model?
The Bowtie Data Model is a Design engagement that defines, calculates, and aligns a full set of revenue metrics across your customer lifecycle, giving every team one source of truth. It maps your metrics to the Bowtie and hands you the definitions, a calculated baseline, and installation guidance for your systems.
What is the Bowtie?
The Bowtie is Winning by Design’s model of the full customer lifecycle, from first touch through retention and expansion. It replaces funnel thinking with a lifecycle view, so acquisition, retention, and expansion are measured as one connected system.
How is this different from the dashboards we already have?
It replaces conflicting dashboards with one agreed set of metric definitions that every team uses. Most dashboards measure activity in different ways. The Bowtie Data Model defines what each metric means first, so the numbers finally line up.
What is included in a Bowtie Data Model engagement?
A Bowtie Data Model engagement includes defined Bowtie metrics, a calculated baseline, cross-functional alignment, and installation guidance for your systems. The work runs across a set of focused workshops over six to eight weeks.
What outcomes should we expect from a Bowtie Data Model engagement?
Expect one shared source of truth, tighter forecasts, and a clear view of where growth compounds and where it leaks. Leaders align on the numbers, and teams measure the lifecycle the same way.
How long does a Bowtie Data Model engagement last?
Most engagements run 6-8 weeks as a one-time design and definition effort. The pace is set by a series of one-hour working sessions across your GTM functions.
What GTM motions or lines of business does it cover?
Each engagement covers a single line of business and up to three GTM motions within it. Additional lines of business are scoped as separate engagements.
Who implements the metrics in our systems?
Winning by Design provides the definitions, specifications, and best practices, and your team implements them in your CRM, dashboards, and BI. WbD-certified technology partners are available directly if you want implementation support.
How are the metrics calculated?
We calculate your baseline from your existing CRM, marketing, finance, and customer success data. Where data is incomplete or inconsistent, we recommend minimum viable reporting standards to close the gaps.
Which roles need to be involved?
Rev Ops leads the engagement, with marketing, sales, finance, and customer success contributing definitions and data. An executive sponsor confirms cross-functional adoption of the metrics as the single source of truth.
What happens after the engagement ends?
You keep a documented set of Bowtie metrics and definitions your teams can run and extend. The model becomes the foundation for later process design, forecasting, and growth planning.
How much does a Bowtie Data Model engagement cost?
Engagements do vary in price depending on scope, company size, and level of customization. Please contact us for a quote tailored to your business and specific needs.
How do we know if this is the right next step for us?
If your teams measure the same journey differently and your forecasts feel like guesses, the Bowtie Data Model is often the right first step. It creates the shared data foundation that process design, enablement, and growth planning all depend on.
Talk with a GTM expert about your growth
We’ll help you understand what’s blocking predictable revenue and recommend the best path forward for your team.
-
Get clarity on the root causes slowing your growth
-
Understand which GTM improvements will deliver the biggest impact
-
Explore pricing, timelines, and the right engagement for your goals