Go-To-Market Diagnostic
TURN GUESSWORK INTO A FACT-BASED GROWTH PLAN
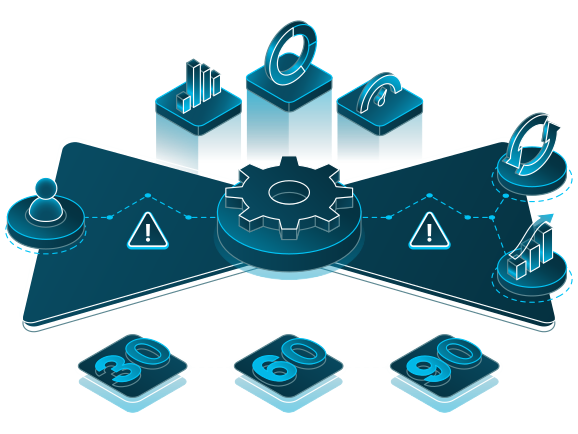
Most growth decisions get made on opinion. The data rarely agrees. The Go-To-Market Diagnostic benchmarks acquisition, retention, and expansion against industry standards. It maps your revenue engine to a single Bowtie model of the full customer lifecycle. You leave with the highest-impact gaps identified and a prioritized 30-60-90 day roadmap your team can run.
Trusted by 1,000+ Companies Just Like Yours










When you can’t see the whole engine, growth becomes guesswork
Slowing growth rarely comes with a clear cause. The numbers dip, but no single view explains why. Teams optimize their own piece while the system underperforms. Big bets get placed on opinion instead of evidence. All signs the engine was never measured as one system.

You can’t see where growth is breaking
Dashboards show activity, not system health. Every team reports its own numbers, and no single view explains why growth is slowing.

Every team optimizes its own piece
Sales, marketing, and success each hit their targets, and growth still stalls. The real problems hide in the handoffs between them.

The big bets rest on opinion
Investment, headcount, and board targets get set from gut feel. Without a benchmark, an ambitious plan looks the same as an unrealistic one.
Trade opinion for a system you can see
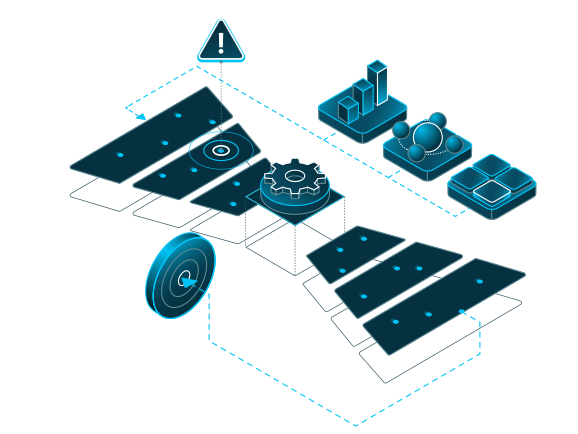
The Go-To-Market Diagnostic turns scattered data into one clear model of your revenue engine. We normalize your numbers into the Bowtie, benchmark acquisition, retention, and expansion against industry standards, and show where growth compounds and where it leaks. For the first time, every team looks at the same picture.
Then the decisions change. Opinion gives way to evidence. Teams align on the same constraints instead of defending their own numbers. Investment flows to the few gaps most likely to move growth. And the view does not end when the engagement does. Through a dynamic dashboard, you keep tracking performance against benchmark long after we leave.
What You Get with a
Go-To-Market Diagnostic
What’s included:
→ A benchmarked Growth Index
Your acquisition, retention, and expansion scored against industry standards, so you see how the engine performs against peers.
→ A single Bowtie model of your revenue engine
All your data normalized into one full-lifecycle view, so every team works from the same source of truth.
→ Stage-by-stage conversion analysis
Where deals accelerate, stall, and leak across the lifecycle, broken down by motion and segment.
→ The highest-impact gaps, identified
The few constraints holding growth back, and the handoffs where the system loses momentum.
→ A prioritized 30-60-90 day roadmap
Executive-ready findings and a sequenced plan, focused on the changes that move growth most.
→ Ongoing monitoring via a living dashboard
A dynamic dashboard you keep after the engagement, so you can track performance against benchmark over time.
Go-To-Market Diagnostic
Get an objective, benchmarked read on how your revenue engine performs. In a few weeks your team gets a single Bowtie model, the highest-impact gaps identified, and a prioritized roadmap. A dynamic dashboard keeps the view live after we leave.

Growth Probability Assessment
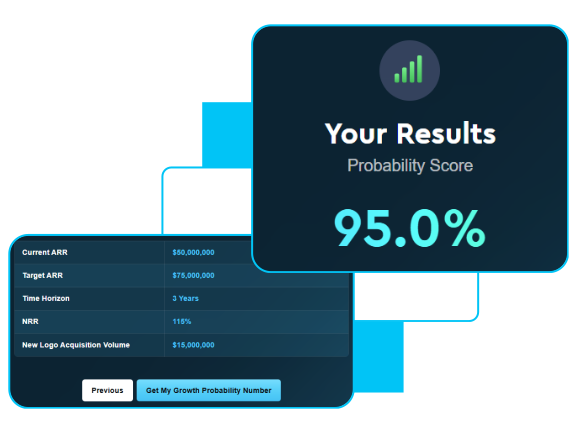
The Diagnostic shows where your revenue engine is leaking. The Growth Probability Assessment shows what that gap costs you against your target. In under two minutes, five inputs return one number: the probability your current system reaches your target ARR on your timeline. It is a useful first data point — and a sharper starting question to bring into any diagnostic engagement.
We’ve built this free, anonymous tool so any growth leader can establish their baseline probability before the deeper work begins.
The Science of Revenue, Proven in Practice
Our frameworks drive repeatable results across sales, success, and revenue operations—validated through customer performance data and real-world outcomes.

Decrease in length of sales cycle

Increase in wins
Increase in ARR year over year

Increase in outbound pipeline share
Your Path to a Clear Growth Plan
Work with the Experts Behind
Modern Revenue Systems




Built for the Leaders Accountable for Growth
For CROs
You own the number and the engine behind it. When growth slows, you need to know exactly where and why, not a debate between teams.
-
See how acquisition, retention, and expansion actually perform
-
Pinpoint where the engine leaks revenue, stage by stage
-
Replace cross-team blame with one shared source of truth
-
Focus investment on the few gaps that move growth most
-
Walk into the board with a fact base, not a forecast built on hope

For Rev Ops / GTM Ops
You live in the data, and you know the numbers rarely tell one story. GTMD gives you a normalized model you can trust and act on.
-
Get your data normalized into one full-lifecycle model
-
Benchmark every stage against industry standards
-
Expose where handoffs and definitions break down
-
Set the baseline metrics the whole team measures against
-
Keep tracking performance via dynamic dashboard after the engagement ends

For CFOs
You fund the growth plan, and you need to know the targets are real. GTMD replaces optimistic assumptions with an evidence-based view of what the engine can produce.
-
Test whether the growth plan is realistic against benchmarks
-
Tie investment to the gaps most likely to move revenue
-
See the cost of inefficiency across the customer lifecycle
-
Bring the board an objective read, not an internal opinion
-
Track progress against benchmark quarter over quarter

For CEOs
You set the growth ambition and carry it to the board. GTMD gives you an unbiased picture of how the engine performs today and a prioritized plan to close the gap.
- Get an objective read on the health of the growth engine
- See where growth compounds and where it decays
- Align the leadership team around one set of facts
- Back a prioritized plan focused on the highest-impact moves
- Move from opinion-led planning to evidence-led decisions

For CMOs
You are one motion inside a larger engine, and your pipeline is judged by what happens downstream. GTMD shows how marketing’s contribution performs across the full lifecycle.
-
See how marketing pipeline converts and retains downstream
-
Move the conversation from lead volume to pipeline quality
-
Locate where the handoff to sales breaks down
-
Tie awareness investment to full-lifecycle performance
-
Ground next year’s plan in benchmarked evidence

Trusted by Leading Revenue Teams


Frequently Asked Questions
What is a Go-To-Market Diagnostic?
A Go-To-Market Diagnostic is a benchmarked assessment of how your revenue engine performs across acquisition, retention, and expansion. It normalizes your data into a single Bowtie model, compares each stage against industry standards, and surfaces the highest-impact gaps holding growth back. You leave with executive-ready findings and a prioritized 30-60-90 day roadmap with a living performance dashboard.
What is the Bowtie?
The Bowtie is Winning by Design’s model of the full customer lifecycle, from first touch through retention and expansion. It replaces the traditional funnel, which stops at the sale, with one connected view of how revenue is won, kept, and grown. The diagnostic normalizes your data into this model so every team measures growth the same way. One shared picture replaces a stack of disconnected dashboards.
How is this different from a GTM audit or the analytics we already run?
A Go-To-Market Diagnostic benchmarks your entire revenue engine against industry standards, while most GTM analytics only report activity within each team. Internal dashboards tell you what each function did. The diagnostic shows how the system behaves as a whole, and where growth leaks in the handoffs between teams. It is an objective, outside-in read, not another internal report.
What is included in a Go-To-Market Diagnostic engagement?
A Go-To-Market Diagnostic includes a benchmarked Growth Index, a single Bowtie model of your revenue engine, a stage-by-stage conversion analysis, the highest-impact gaps identified, and a prioritized 30-60-90 day roadmap. You also keep a living, dynamic dashboard after the engagement, so you can track performance against benchmark over time. Every finding is evidence-based and ready to take to your leadership team.
What outcomes should we expect from a Go-To-Market Diagnostic engagement?
You should expect a clear, evidence-based picture of how your revenue engine performs and a prioritized plan for where to focus next. The diagnostic replaces opinion with benchmarks, aligns your teams around the same constraints, and points investment toward the gaps most likely to move growth. It does not promise a specific number. It gives you the facts to make better growth decisions and lower the risk of betting on the wrong fix.
How long does a Go-To-Market Diagnostic engagement last?
A Go-To-Market Diagnostic takes 4-6 weeks, from data collection to final readout. The first phase collects and normalizes your data. The second benchmarks and diagnoses performance. The third delivers the prioritized roadmap. Timeline varies with data readiness and the number of motions in scope.
How soon will we see value?
You get clarity at delivery, in a 4-6 weeks, when you receive the benchmarked findings and the roadmap. The diagnostic produces evidence and priorities, not pipeline on its own. Revenue impact follows from acting on the roadmap, which is sequenced so the highest-impact moves come first. With the living performance dashboard, you can track progress against benchmark from that point forward.
What does the diagnostic measure, and how do you benchmark?
The diagnostic measures conversion, volume, and velocity at every stage of the Bowtie, then benchmarks each against industry standards. Your data is normalized into the Bowtie so the numbers are comparable across teams and against peers. The Growth Index scores acquisition, retention, and expansion against those standards. Together they show where you lead, where you lag, and where the biggest gaps sit.
Which roles need to be involved?
The diagnostic needs an executive sponsor, usually the CRO, and an owner of your GTM data, usually Rev Ops. The sponsor sets the questions the diagnostic answers and acts on the roadmap. Rev Ops provides access to data across marketing, sales, and success. Leaders from each function help validate findings and align on priorities. The lift on your team is light, mostly data access and a few working sessions.
What happens after the engagement ends?
You keep a living, dynamic performance dashboard that tracks your revenue engine against benchmark after the engagement ends. Most diagnostics end with a slide deck and a goodbye. This one leaves you with a living view, so you can watch performance move toward the standards the diagnostic set. If the findings point to deeper work, the roadmap shows what to sequence next, whether your team runs it or we do.
How much does a Go-To-Market Diagnostic cost?
Engagements do vary in price depending on scope, company size, and level of customization. Please contact us for a quote tailored to your business and specific needs.
How do we know if this the right next step for us?
A Go-To-Market Diagnostic is the right next step when growth is slowing or getting more expensive and you cannot clearly explain why. It fits teams making big growth or investment decisions without an objective, system-level view. If your real question is board-level feasibility, whether the target is achievable and where to place capital, that is our Growth Guidance offering, and the two often run together. If you want the operational truth first, start here.
Talk with a GTM expert about your growth
We’ll help you understand what’s blocking predictable revenue and recommend the best path forward for your team.
-
Get clarity on the root causes slowing your growth
-
Understand which GTM improvements will deliver the biggest impact
-
Explore pricing, timelines, and the right engagement for your goals